
Technologist in Software, AI, and Infrastructure Orchestration
May 27, 2021 31 min read
Amazon ECS Scalability Best Practices
Note: There is now an updated version of this presentation available on Containers on AWS: “Amazon ECS Scalability Best Practices”
On May 26th I gave a talk on best practices for scaling with Amazon ECS. You can watch a recording of the talk below. (Apologies in advance that the sound quality is not quite up to my normal standards.)
You can download the original PowerPoint deck for this talk:
Talk Transcript
Welcome back everyone! As Container Day continues we are now going to talk about Amazon ECS Scalability Best Practices. My name is Nathan Peck. For those of you who may not know me, I am a senior developer advocate at AWS, in the container services organization, and prior to that I was actually an Amazon ECS customer. So in total I’ve been using Amazon ECS for almost 6 years now and have done quite a bit of scaling on top Amazon ECS.
Today I want to share some of the tips and things I’ve learned over the years scaling ECS services.
The first thing I want to start out with is a quick look at how to think about scaling with containers on Amazon ECS. And what I want to introduce is that in order to have good scaling you have to have an application scaling mindset. And it will carry through to everything else that we talk about with scaling on Amazon ECS.
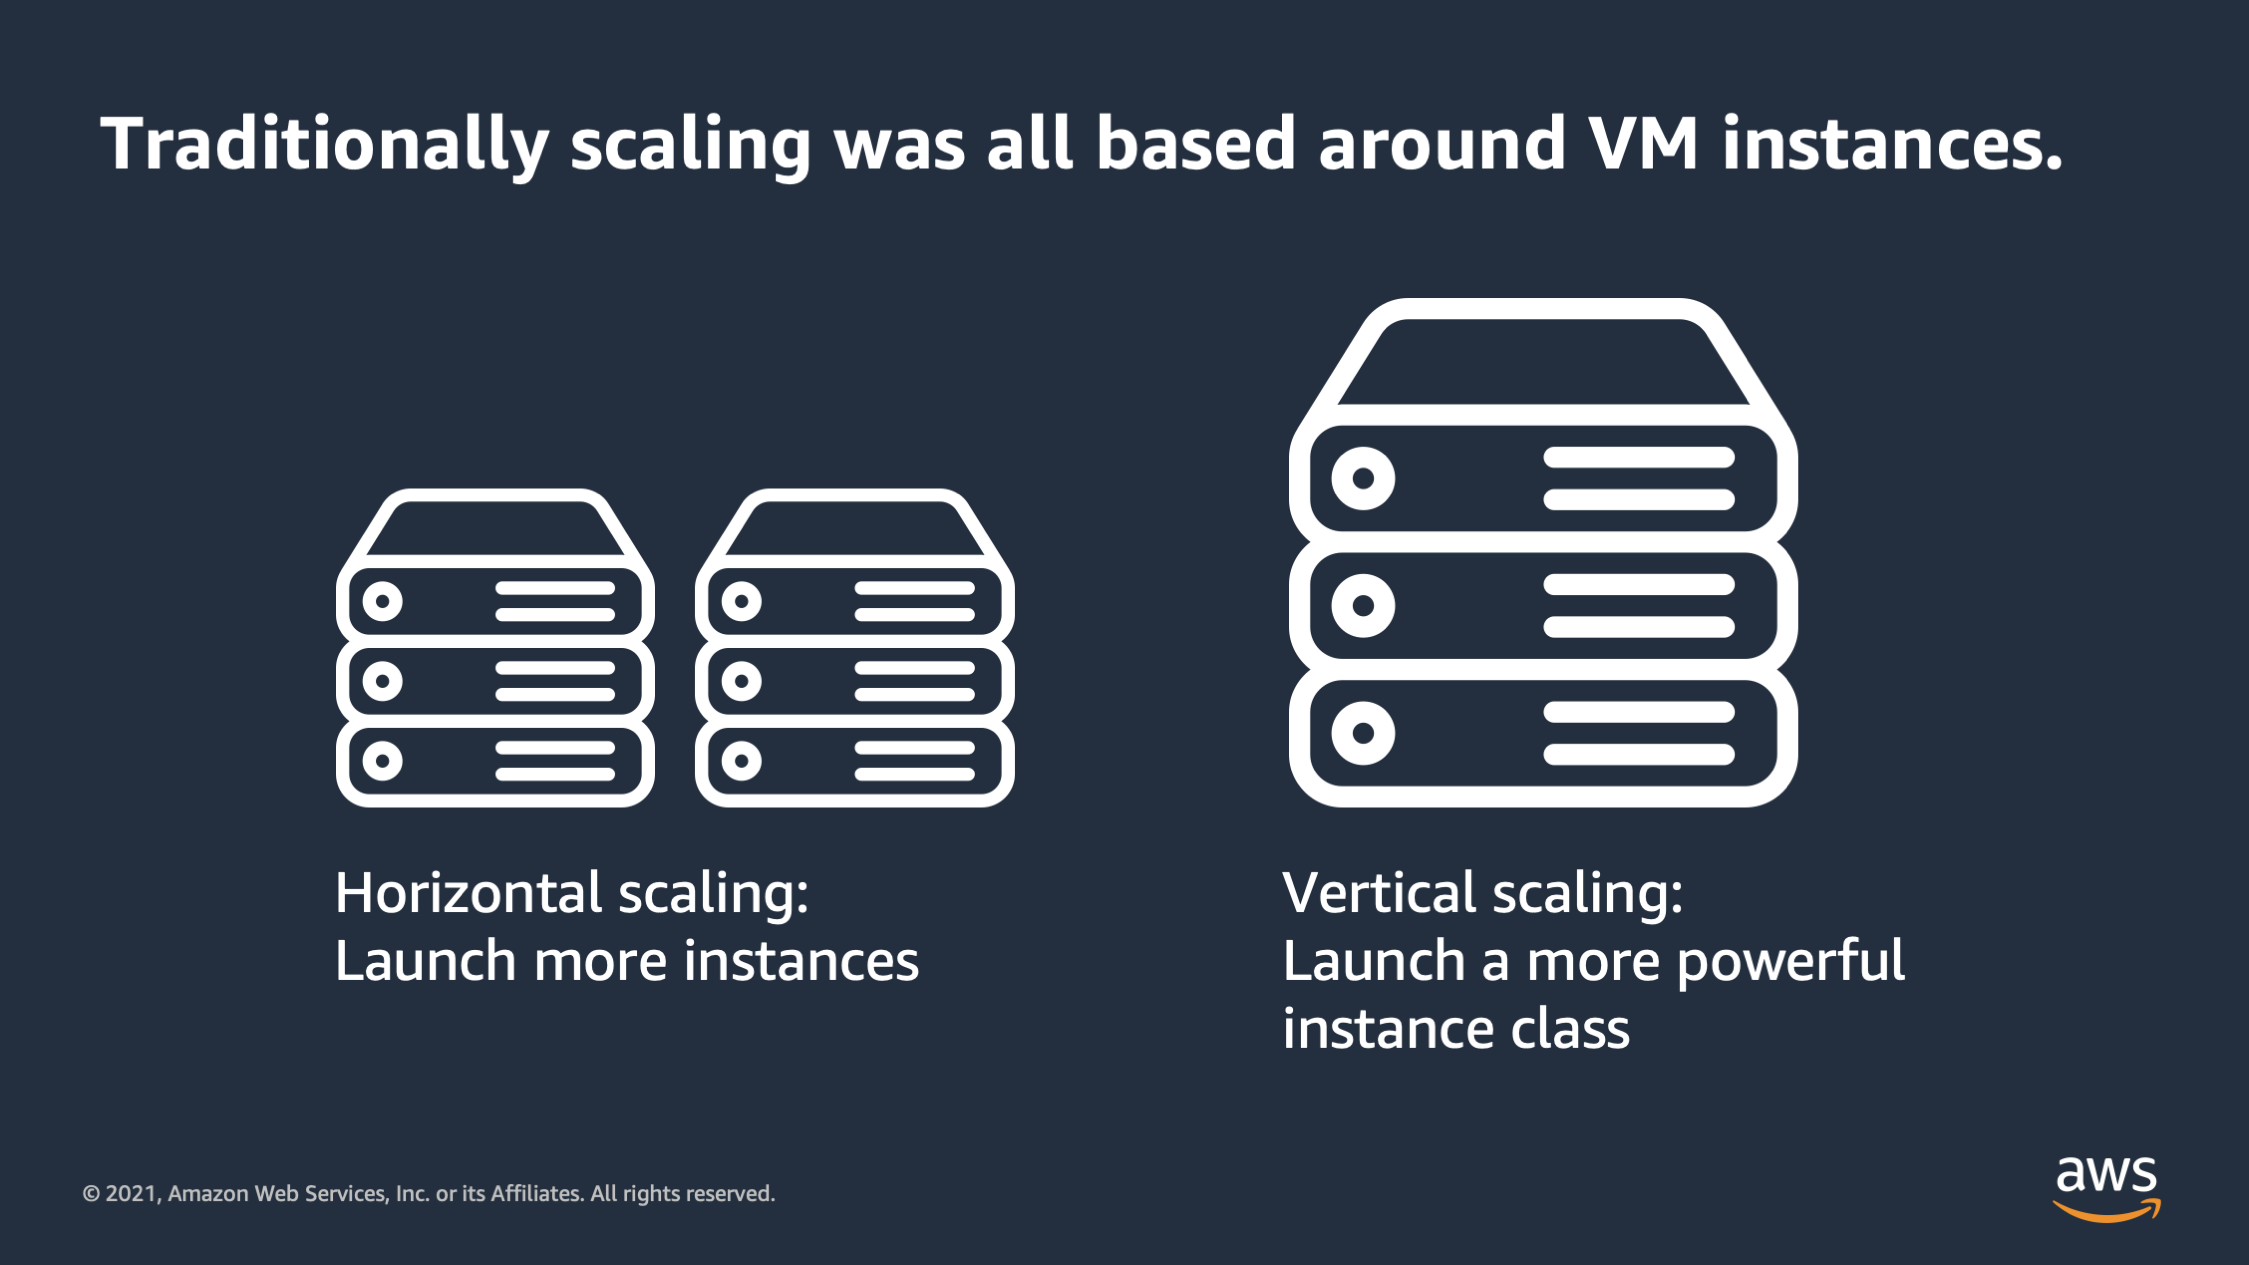
To set the context let’s start with how scaling was traditionally thought of: and that is was all around the VM instances. So traditionally you would have a data center and you had virtual machines inside of it of physical hardware, and if you wanted to add more physical capacity you would launch more VM’s or add more servers to your racks, and if you wanted to vertically scale you would launch a larger VM or you would put a larger server into the rack. Now there was a problem with this type of scaling.
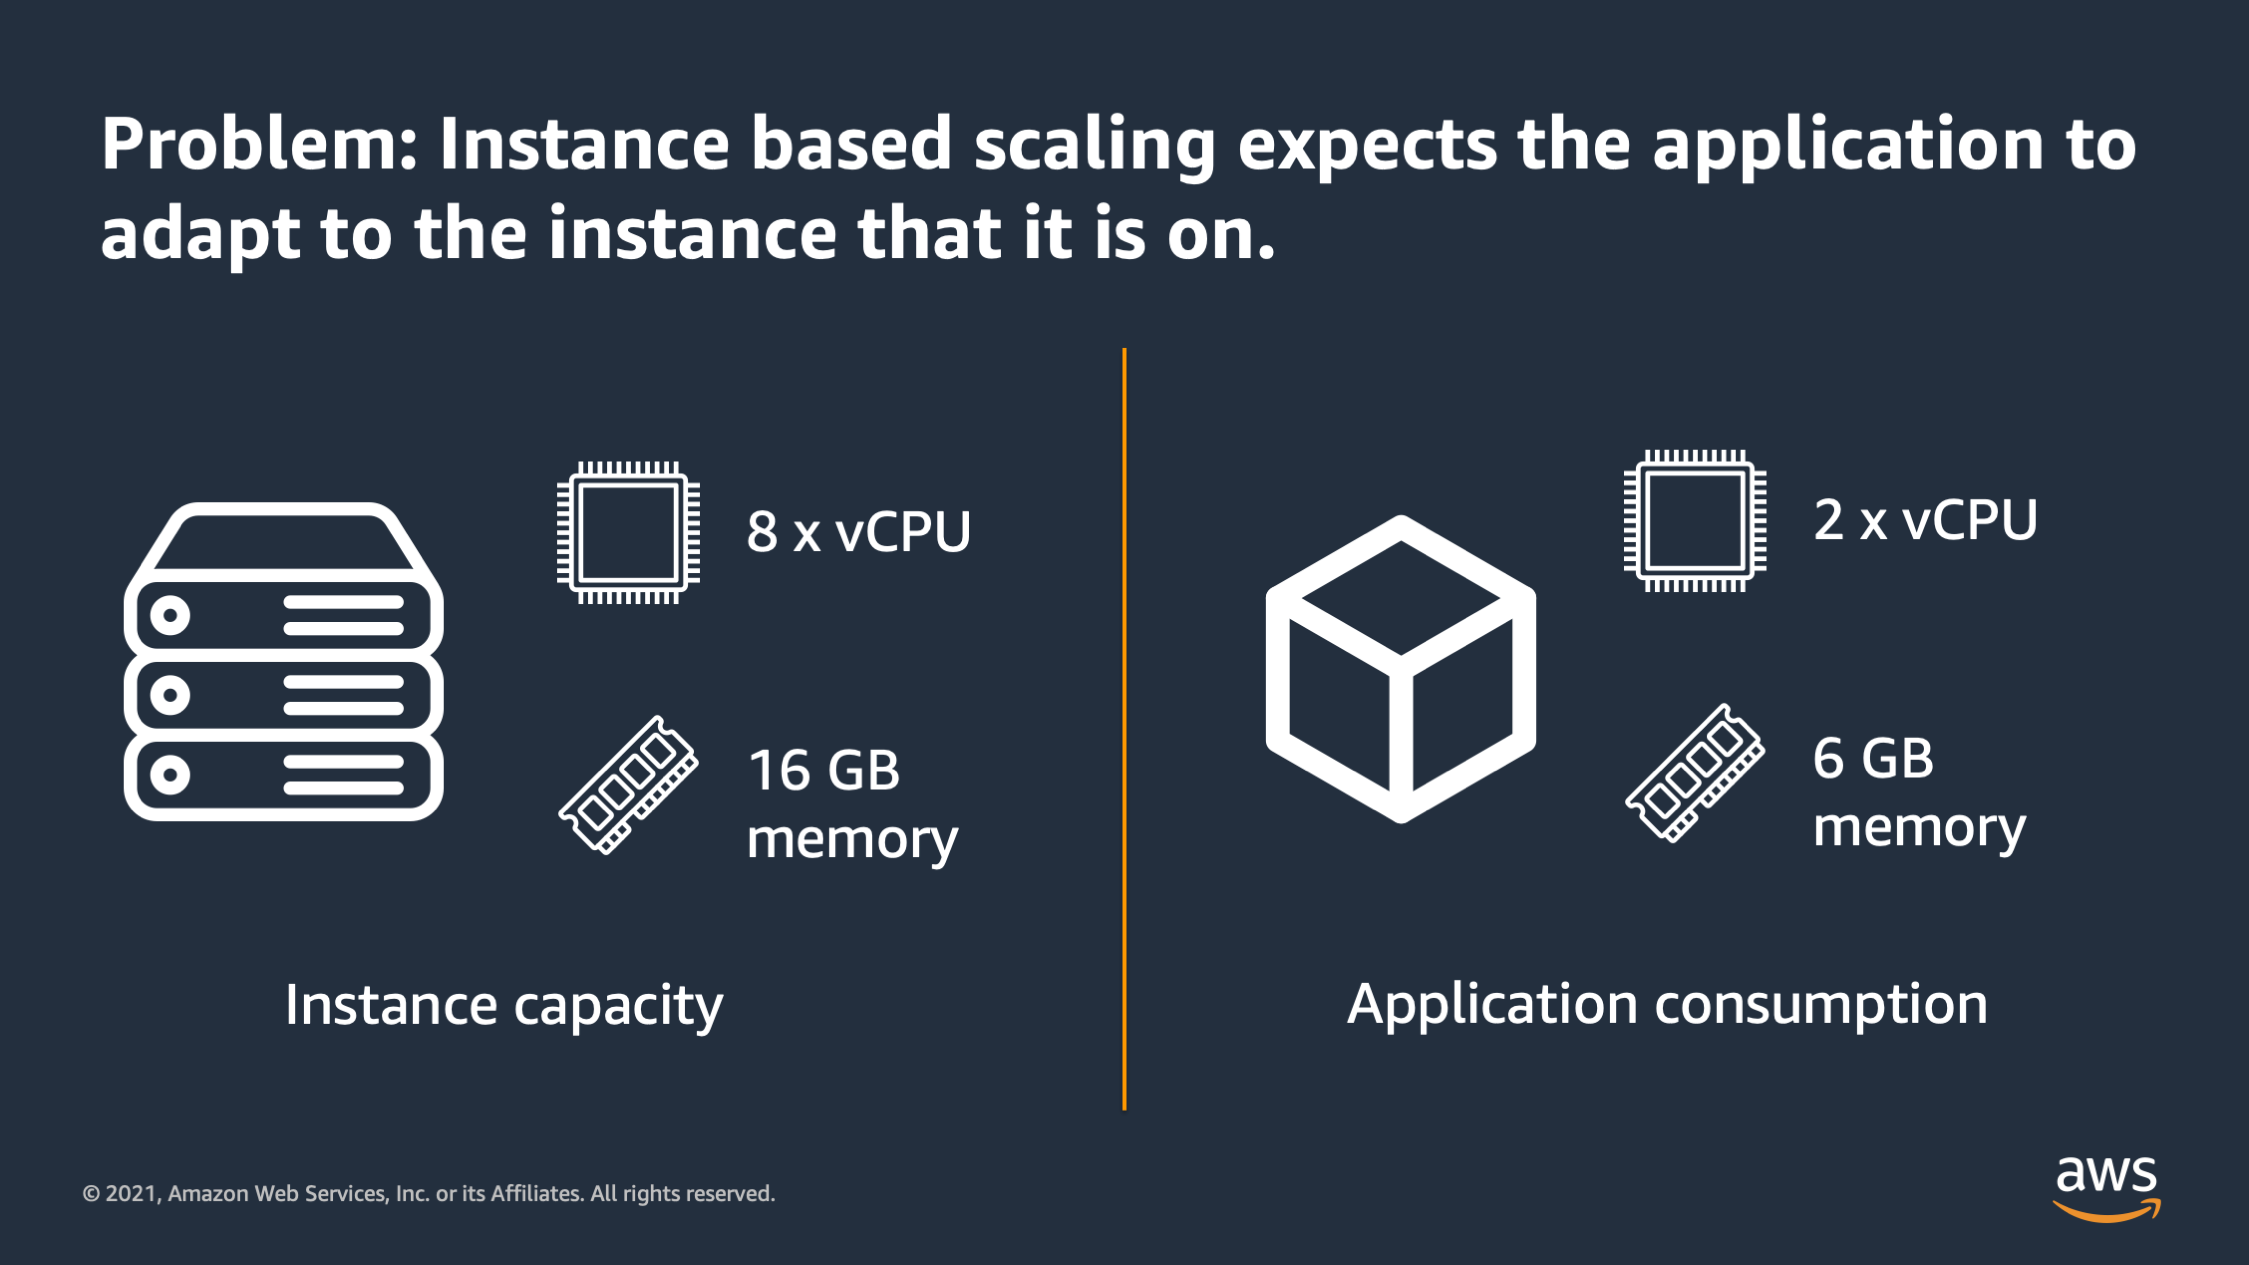
And that problem is that when you scale based on server or VM’s instances it expects that the application is always going to adapt to whatever instance it is on. So here for example in this diagram you can see and instance which has 8 vCPU’s and 16 GB of memory, but then you have an application which is only using 2 vCPU and 6 GB of memory. So there is a mismatch between the amount of resources that the instance has and the amount of resources that the application actually needs.
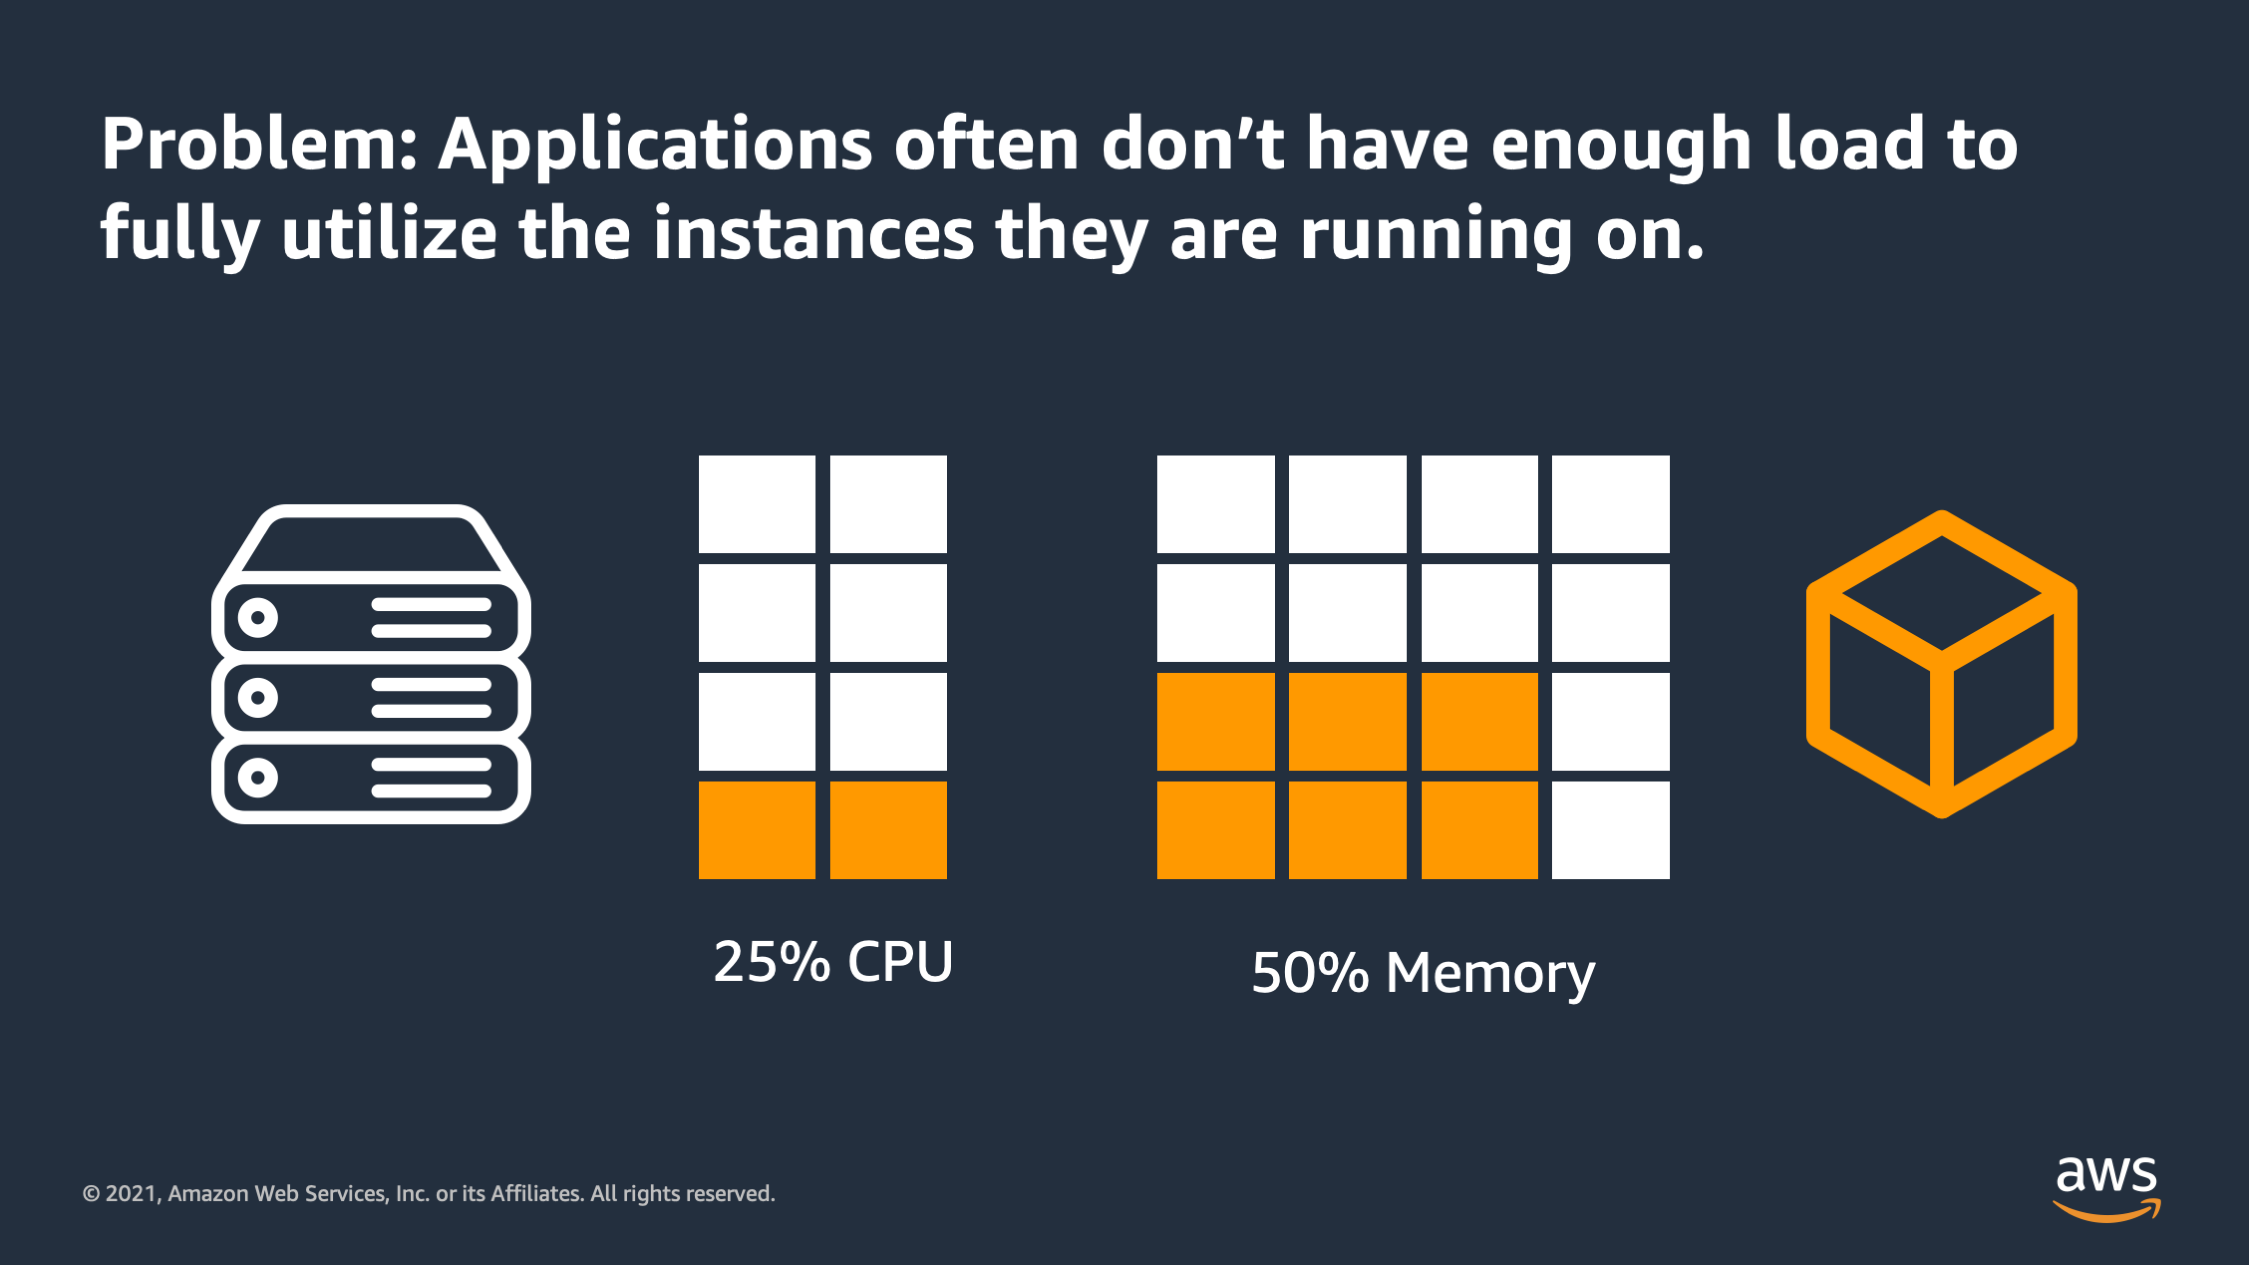
So that leads the problem that applications often times don’t have enough load to fully utilize the instances that they are running on. You see this when you have an application doesn’t actually receive enough traffic, or occasionally it bursts and receives more traffic, but it doesn’t always have enough traffic to fully utilize a server or VM. So all that white space in the diagram is being wasted; you can see only a small fraction is actually being utilized.
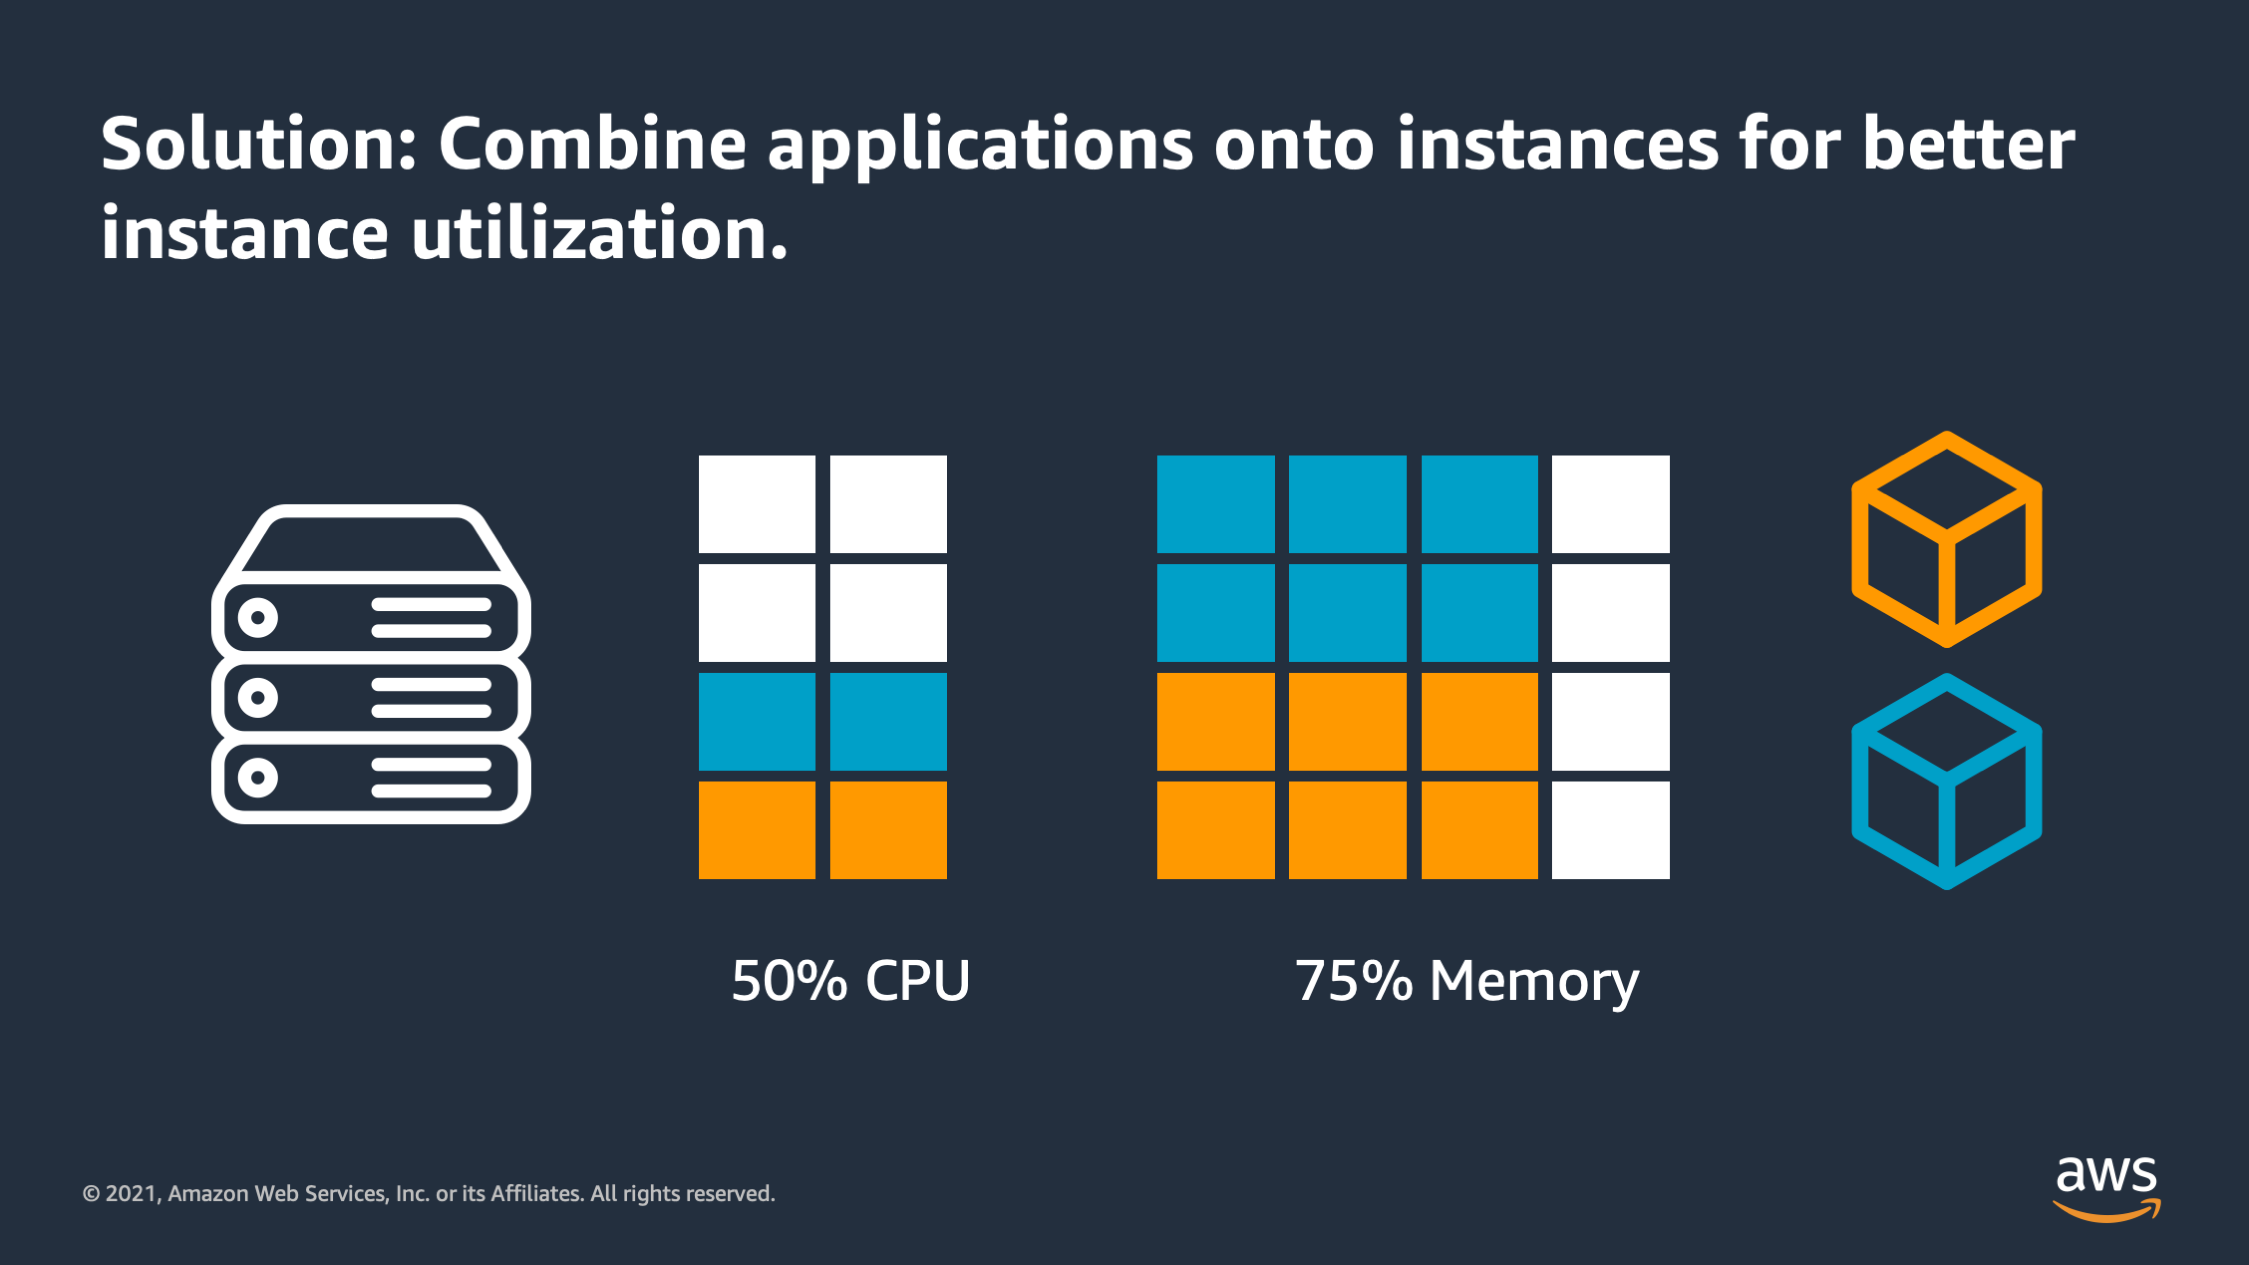
So one potential solution to this problem is to combine applications onto instances so you can get better instance utilization. So here you can see two applications: the orange application and the blue application. They have been put together onto the instance and as a total we now have a more reasonable 50% CPU utilization and 75% memory utilization. That’s not bad, but we still have some problems with this setup.
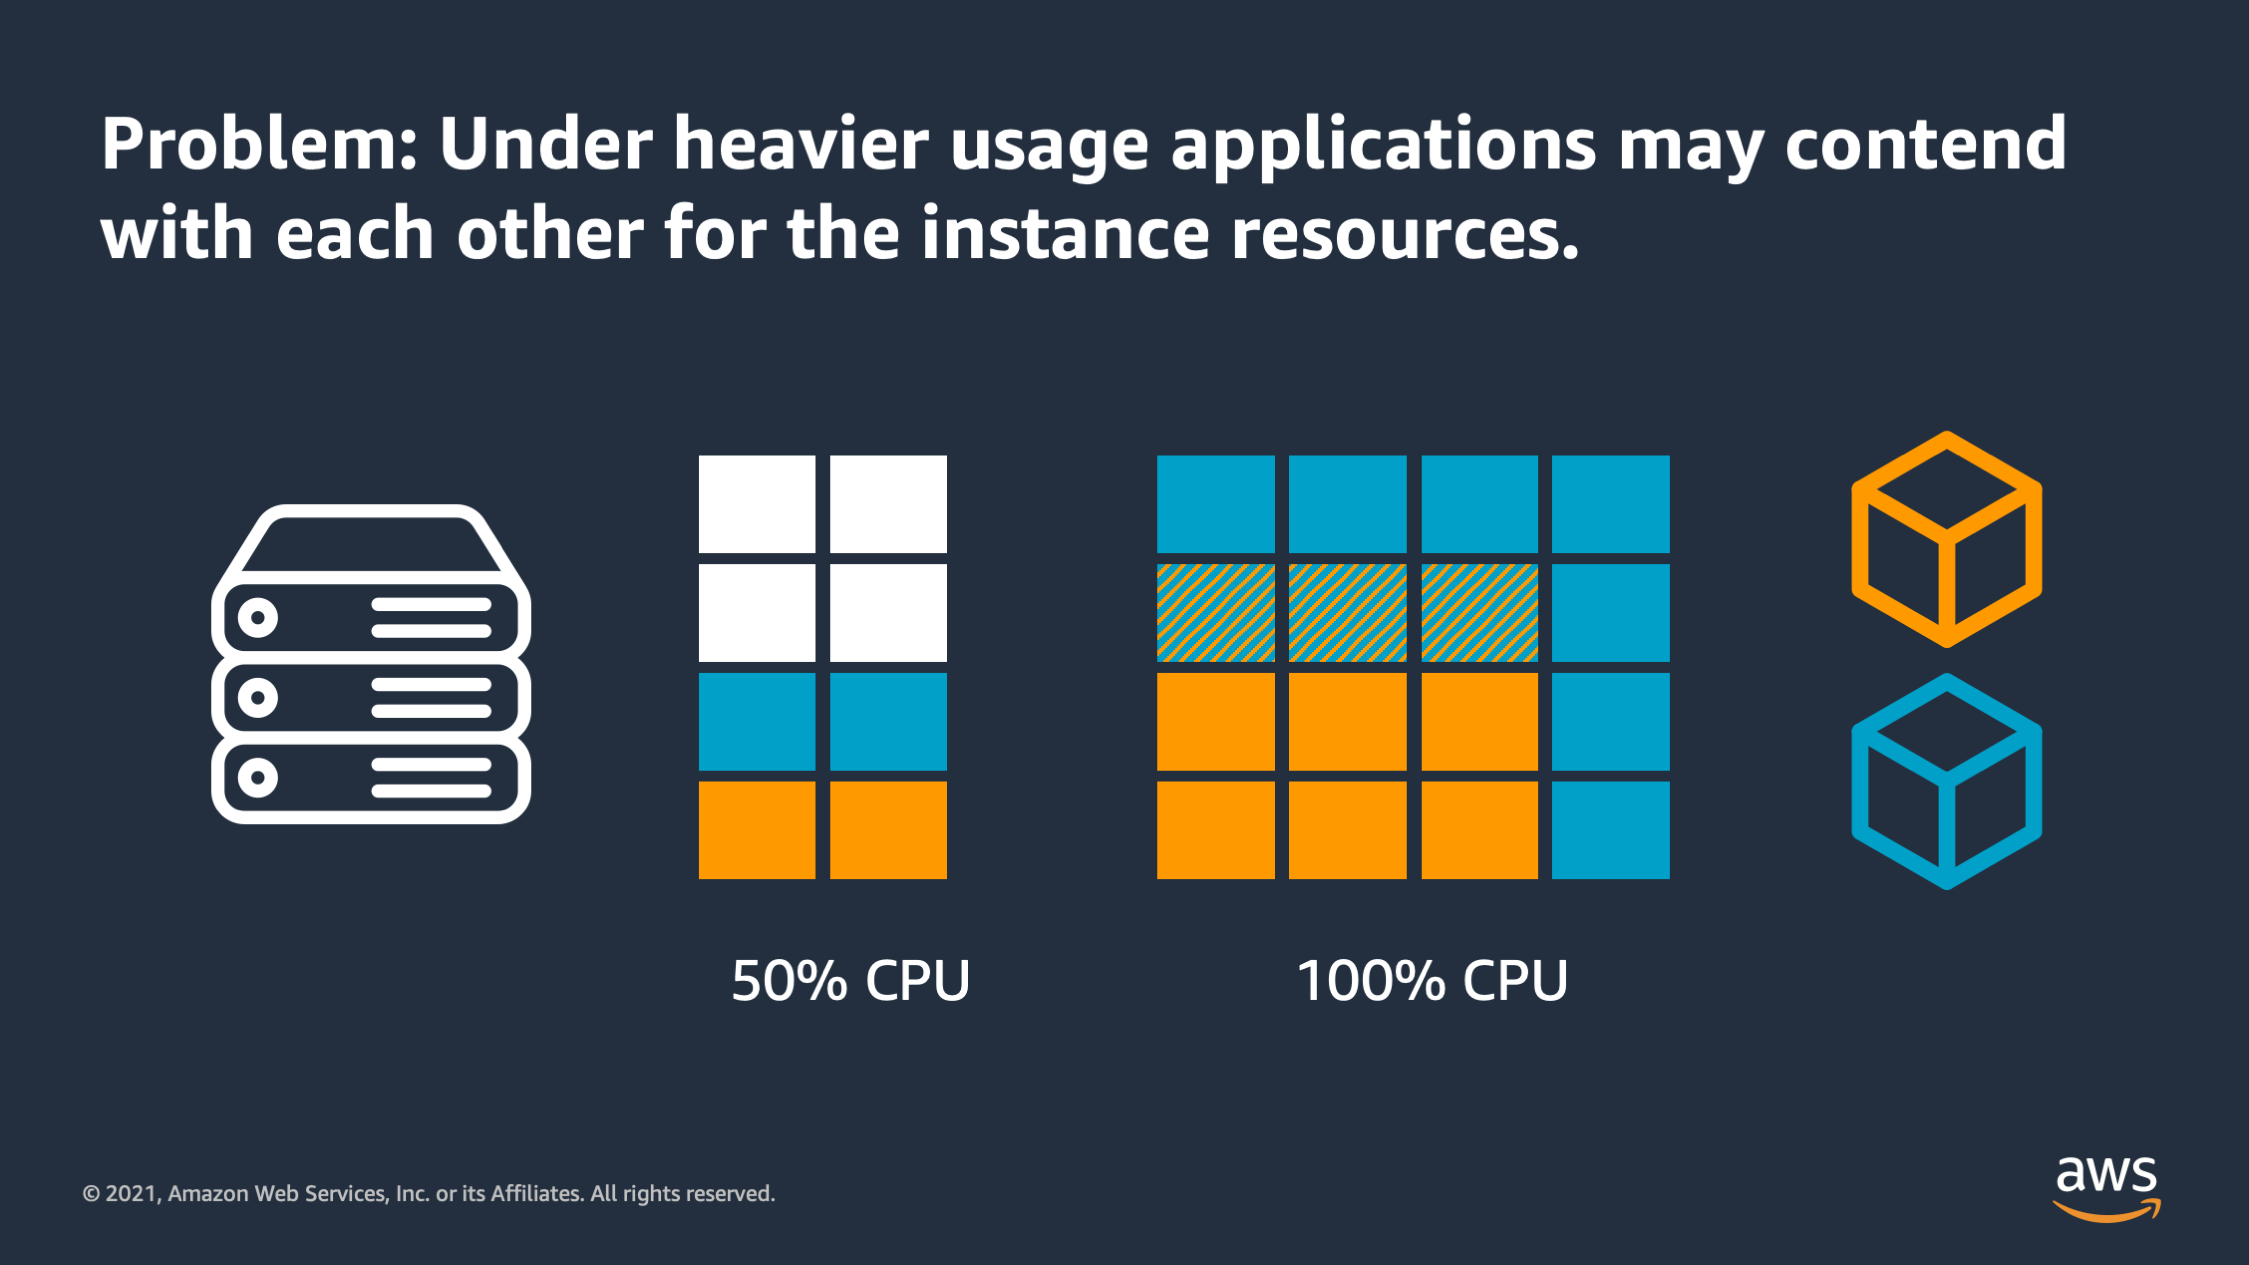
Earlier I said application might have an occasional burst of activity. Well when that happens what we end up with is applications competing with each other for the resources that are available on those instance. So here we see an overlap between how much CPU the blue application and how much CPU the orange application actually wants. And because of that they are competing with each other for that limited resource.
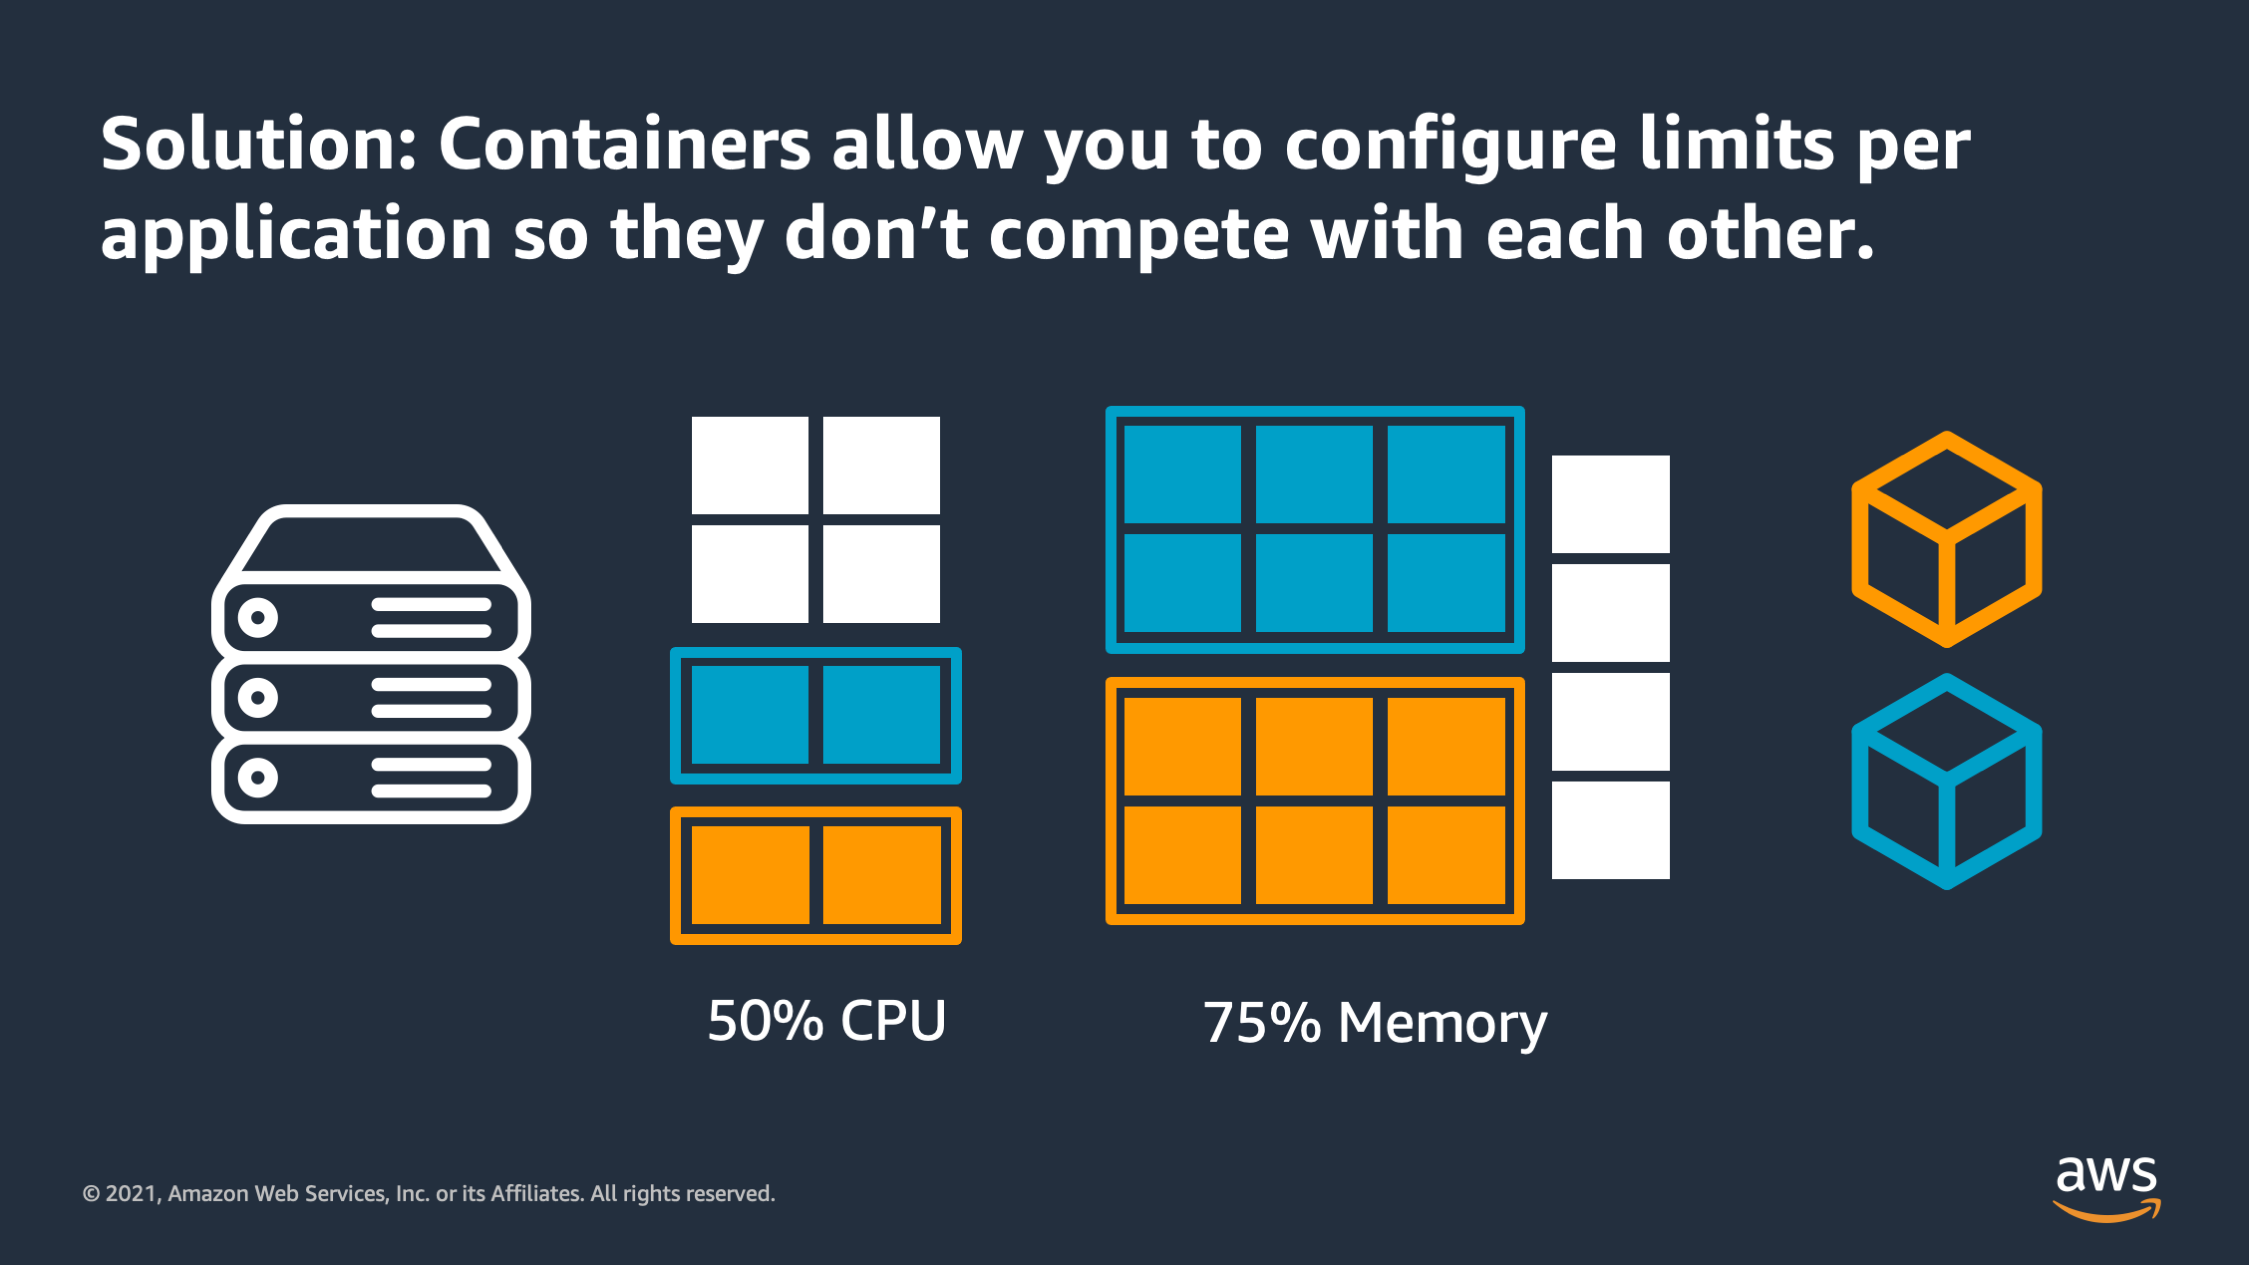
Containers were created as a solution to help you configure limits per application so that you can put multiple applications onto a server or VM and they wouldn’t compete with each other. Each of them has a boundary around resources that it needs to reserve on that instance and that way it won’t compete with the other services when there is a resource constraint and both of these applications are demanding high levels of resource.
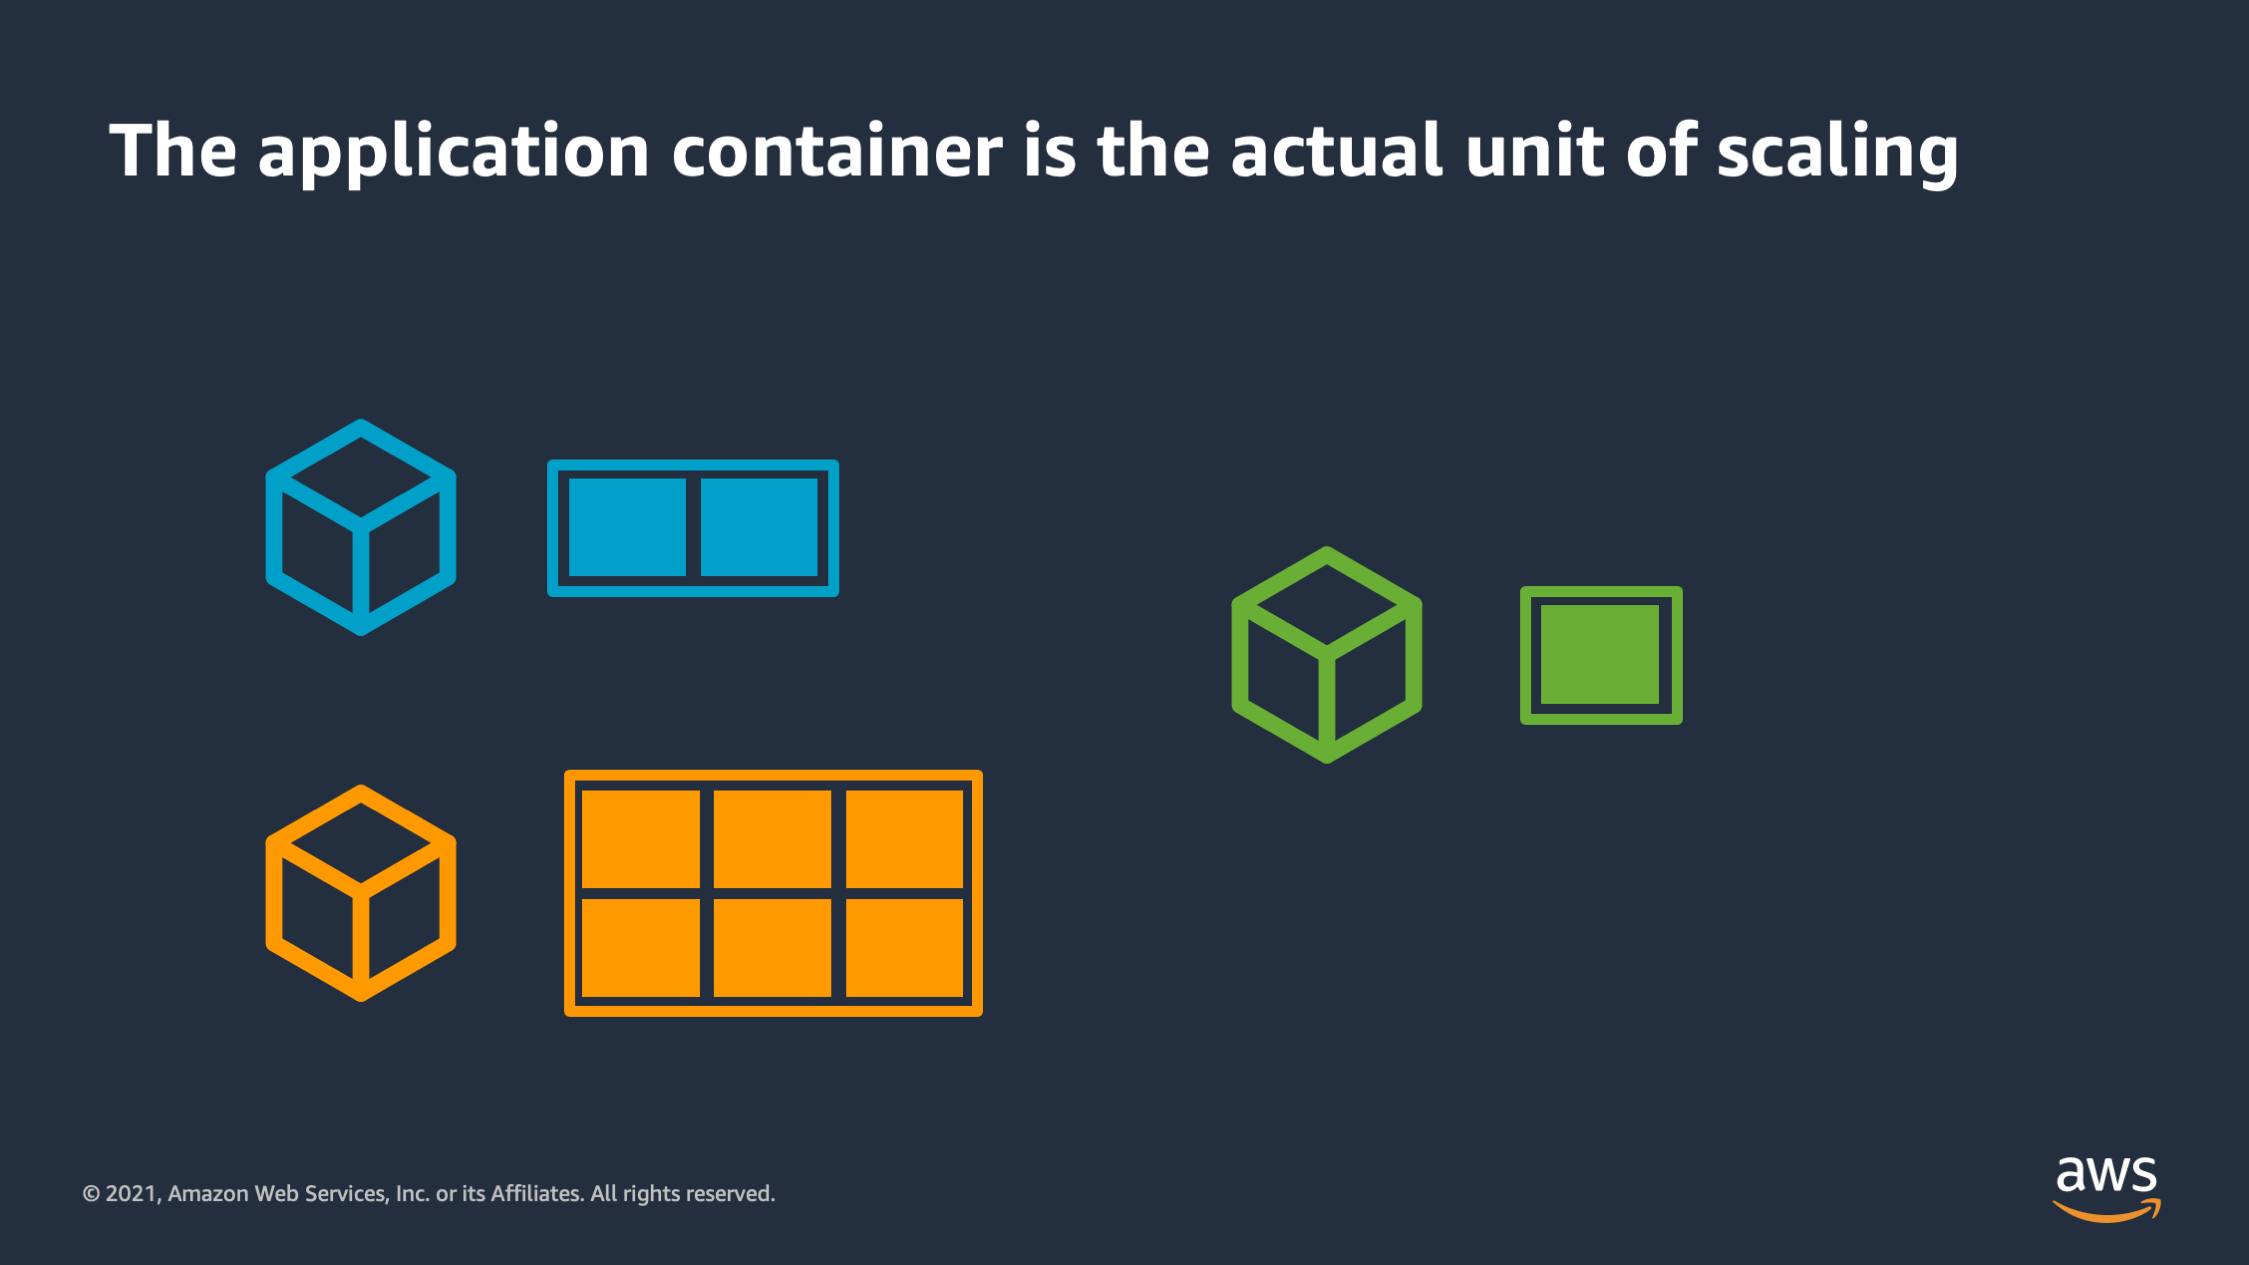
Once you start to put a box around the resources that an application requires you start to realize that in this scenario the VM is no longer the unit of scaling. Instead the application container is the actual unit of scaling and the resources that application container needs is what we are scaling up and down on.
This is what I mean by having an application first mindset to scaling.
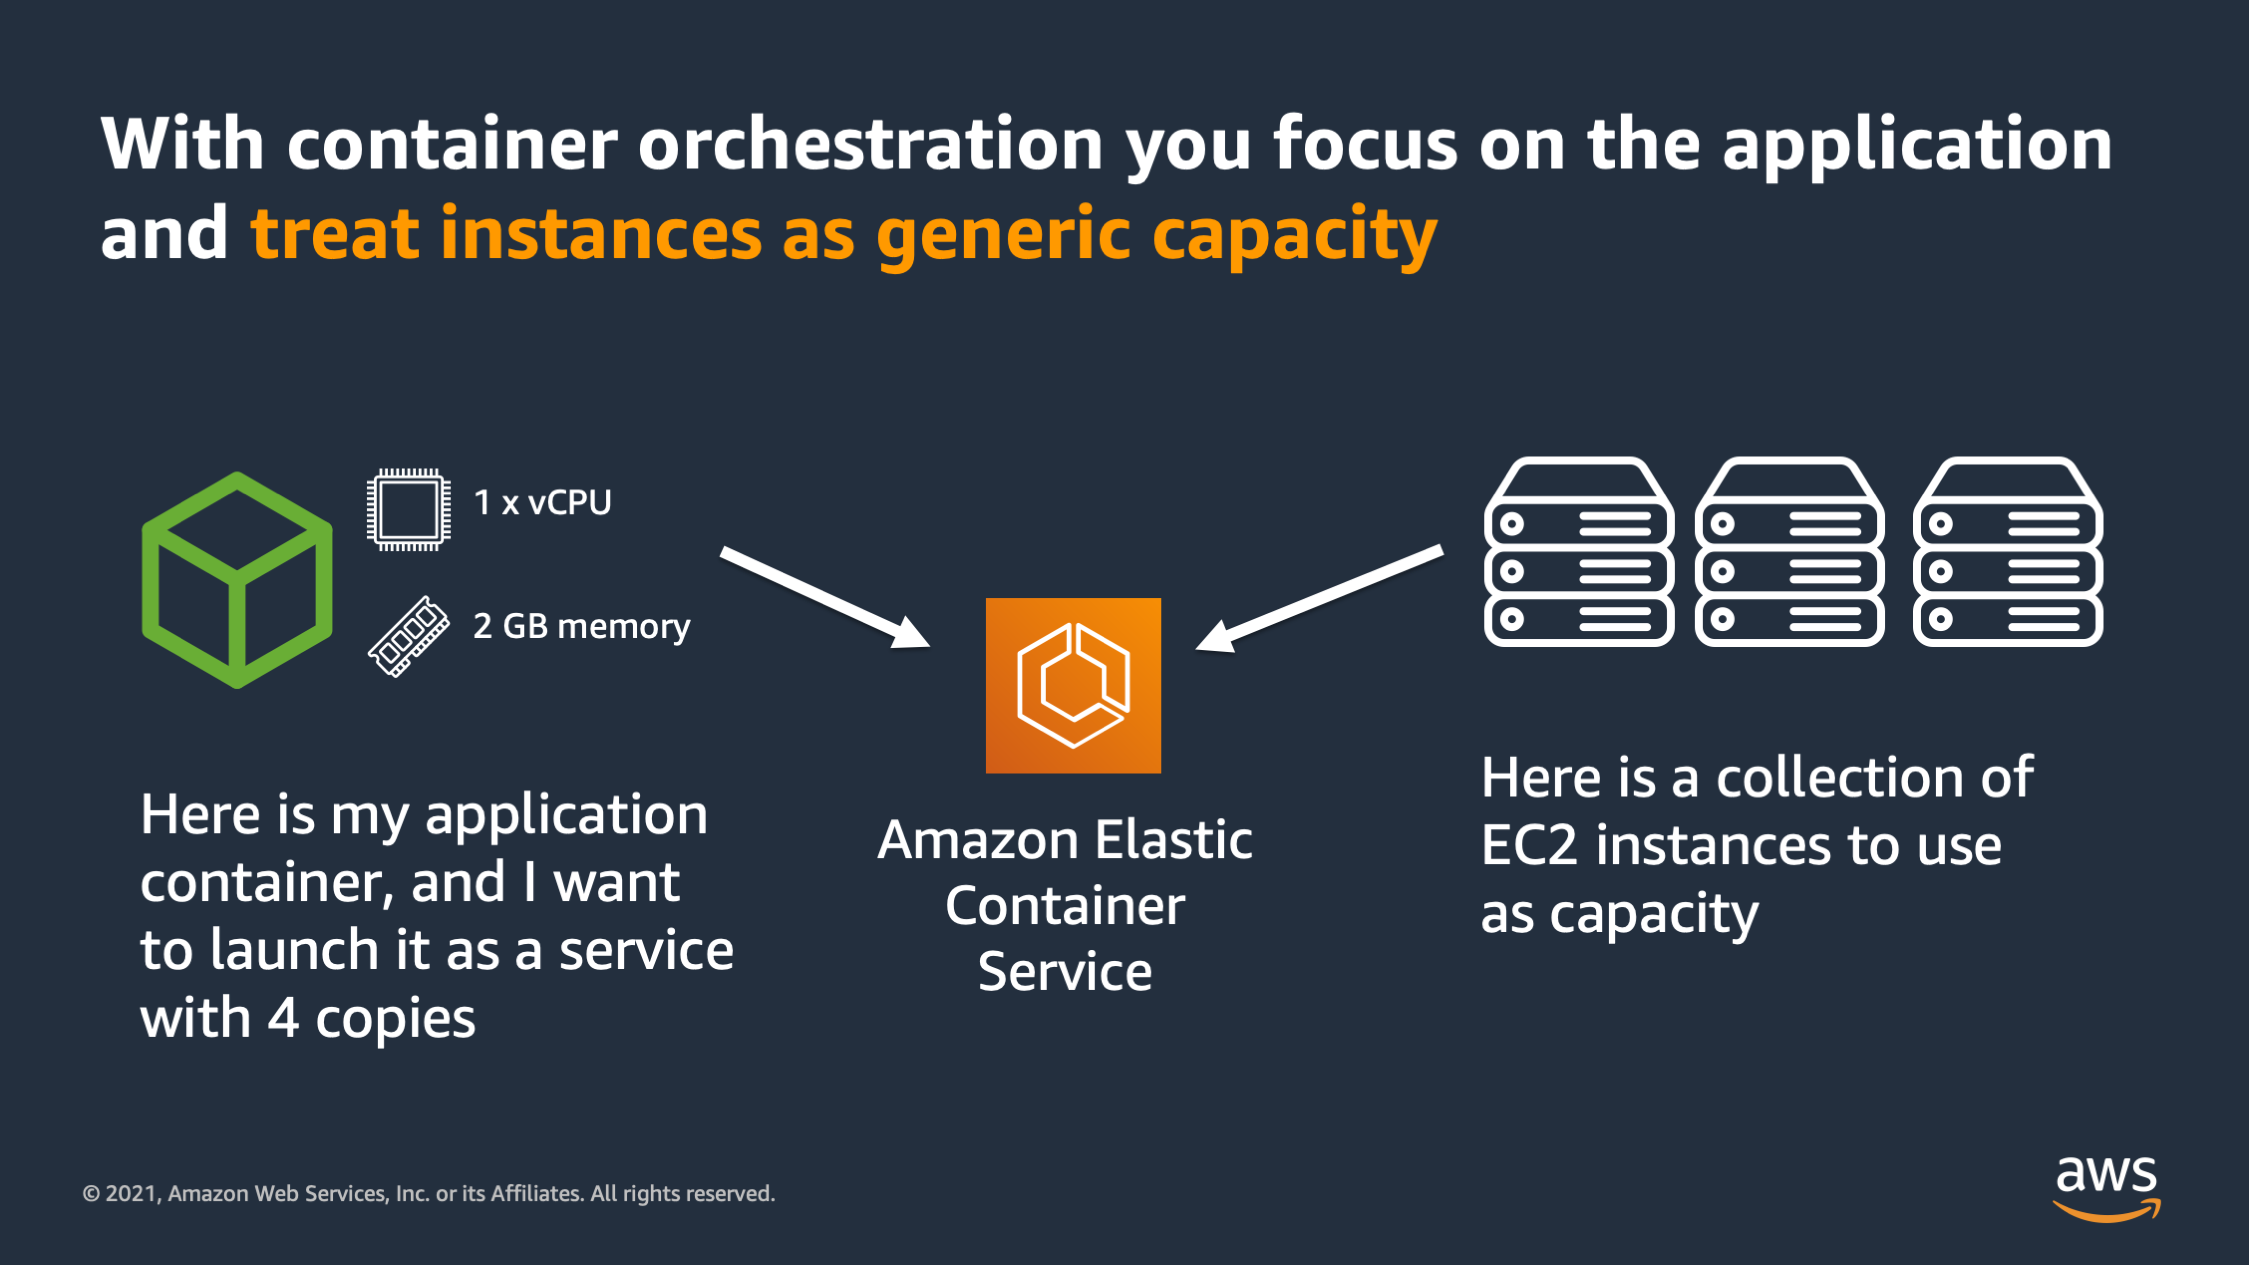
And container orchestration is something that helps enable you to have that application first mindset. The reason why is because it allows you to focus on the application by treating the instances and VM’s underneath as generic capacity. Here’s how that works. When you have an orchestrator such as Amazon Elastic Container Service you can specify your application, and the resources that are required, such as 1 CPU and 2 GB of memory. And then you can specify how many copies of that application you want to run. Separately you can give Amazon ECS a collection of instances to use as capacity.
These EC2 instances don’t have to be all the same size, they don’t have to be the same generation or have the same amount of CPU and memory. They can just be a random collection of devices and CPU’s and memories. Then you tell ECS “I would like to run 4 copies of my application on this collection of instances”.
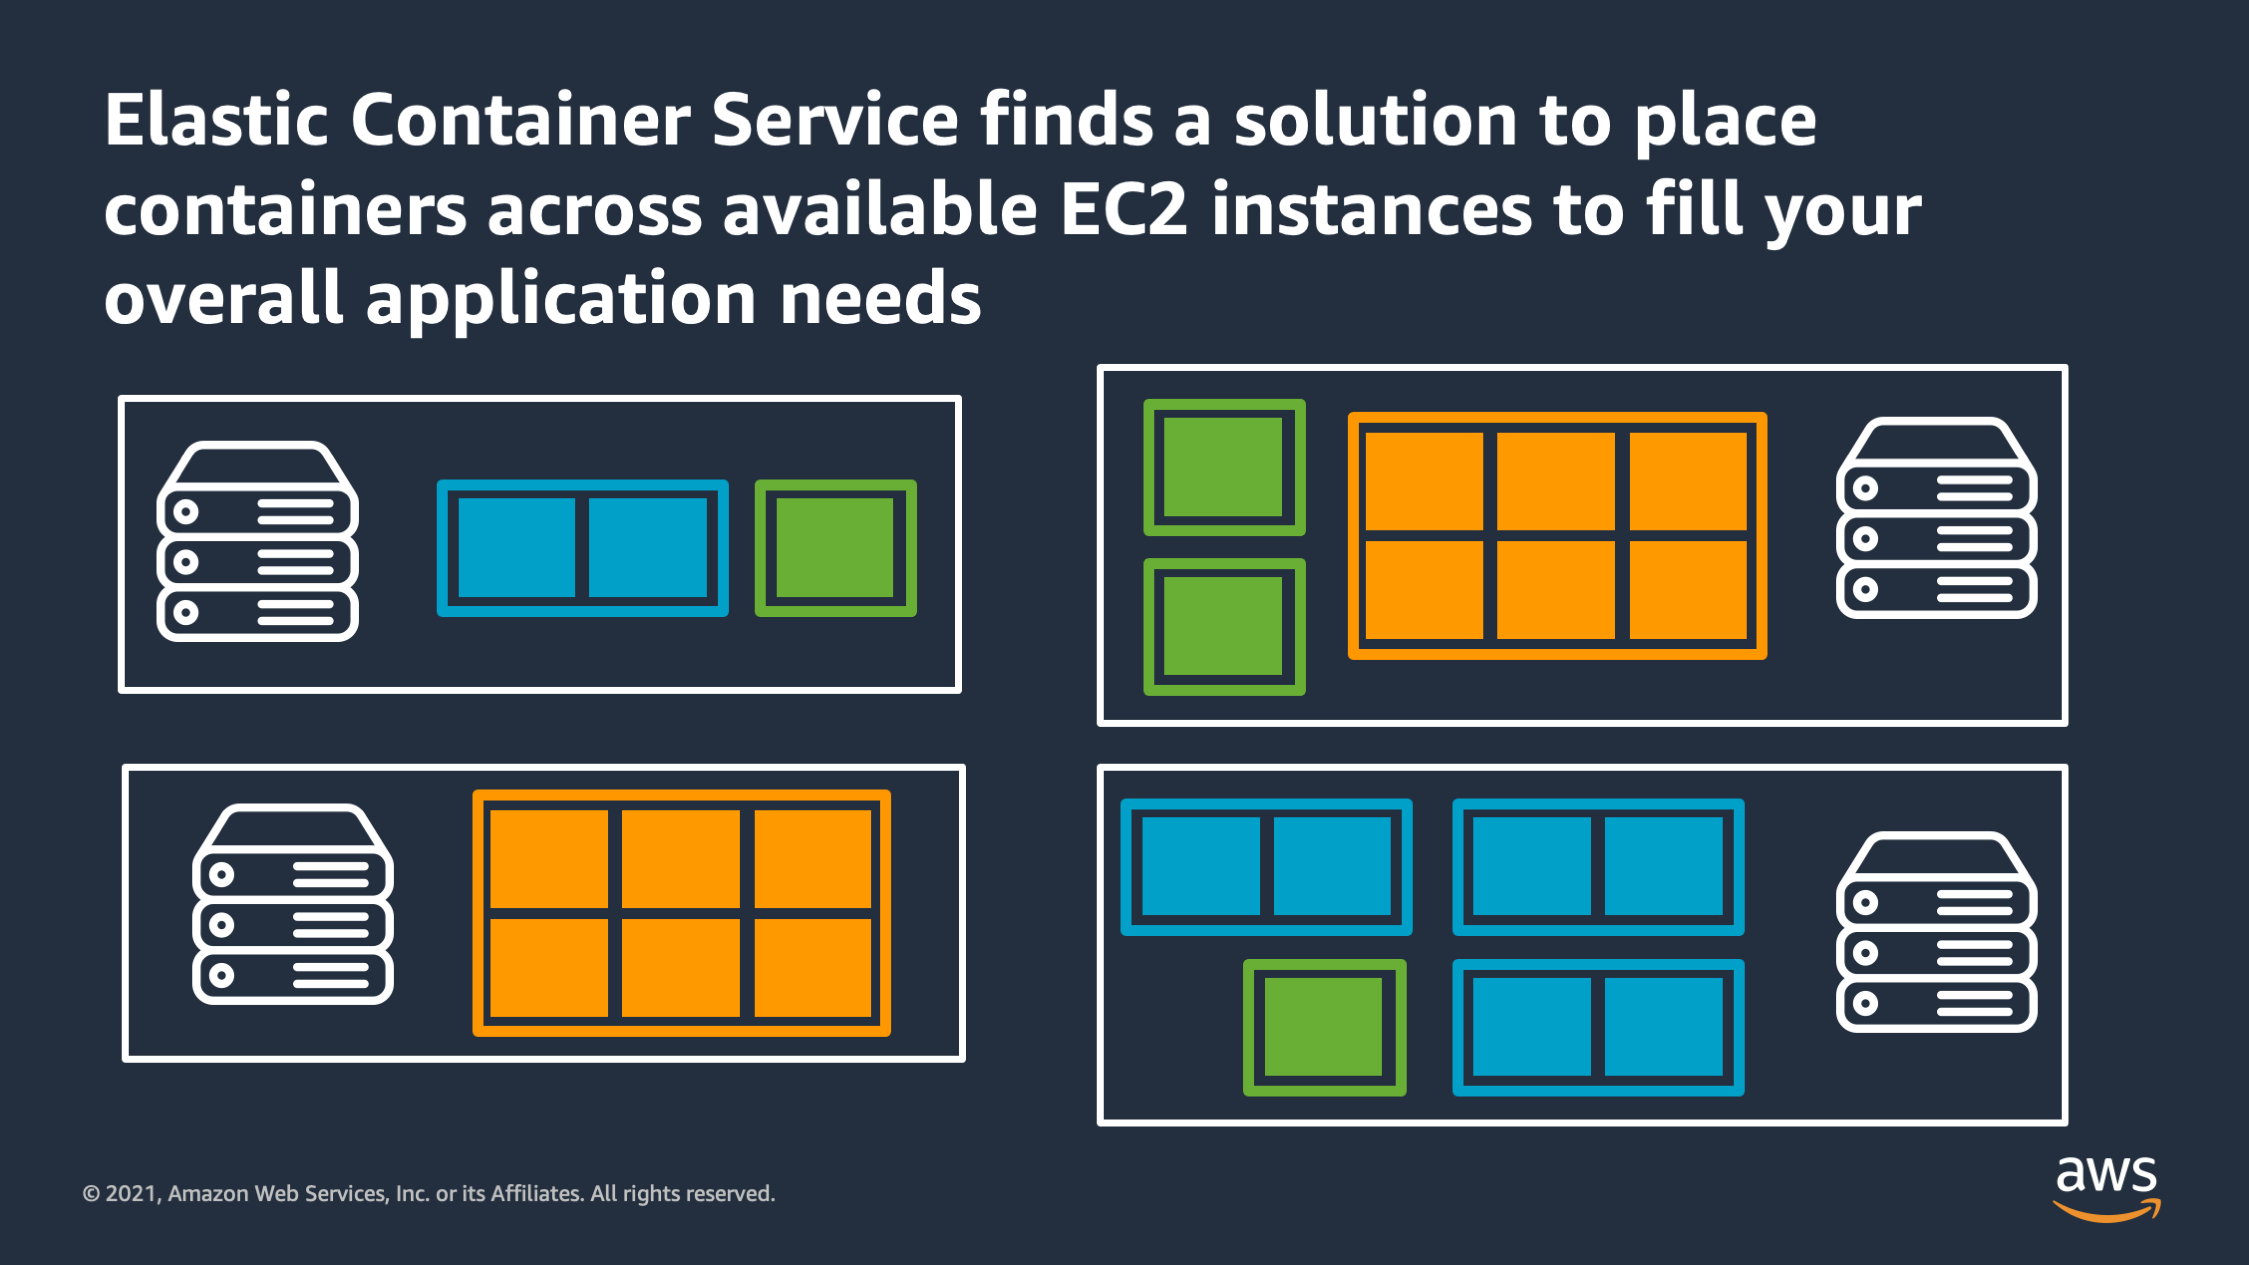
And Amazon ECS looks at all the available capacity from all the servers that you gave it and it finds a solution to place containers across the instances to fulfill your overall request. Here there are three different types of applications of three different sizes, and we’ve told ECS that we want to run them across these 4 instances. And Amazon ECS has found a solution to place these containers onto these instances in a way that they will fit and can share the resources without overlapping with each other.
So this is the job that ECS does: it lets you think about the application first, and think about the server or VM’s as just capacity that you provide under the hood, but don’t have to worry about as much.
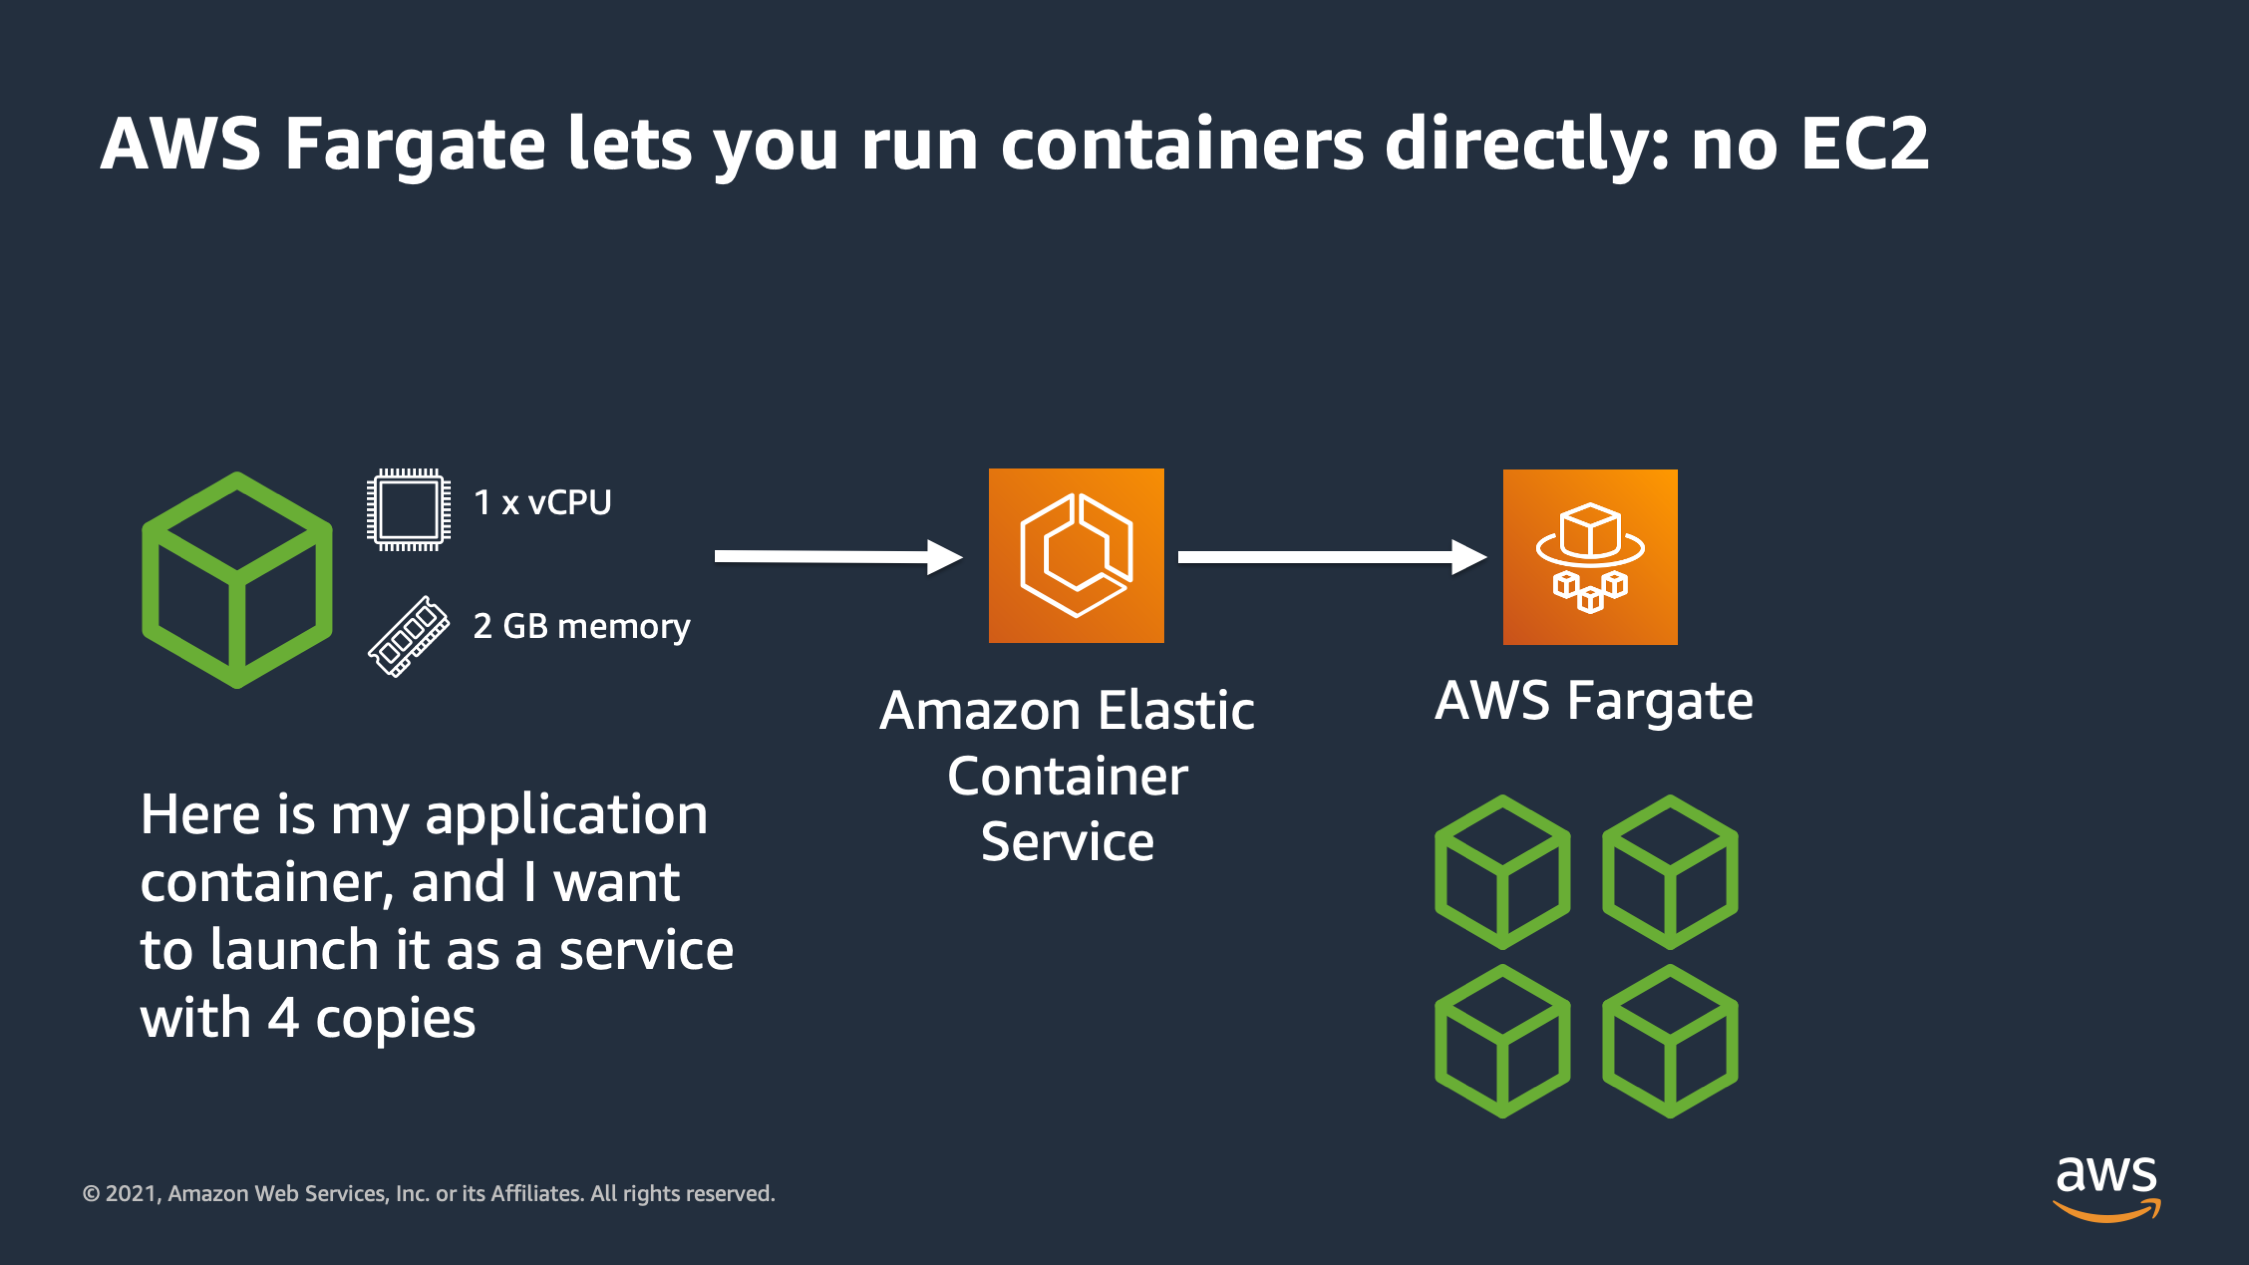
Added to that, there is a new paradigm as well: the serverless container. AWS Fargate is a prime example of that. It allows you to run containers directly. You no longer have any EC2 instances to worry about. With Fargate you say “here is my application container that I want to run. It takes 1 CPU and 2 GB of memory and I would like you to run it.”
Amazon Elastic Container Service actually goes to AWS Fargate and tells it to run 4 copies of the container. AWS Fargate runs those containers directly. You don’t have to supply any EC2 instances to serve as capacity for the cluster.
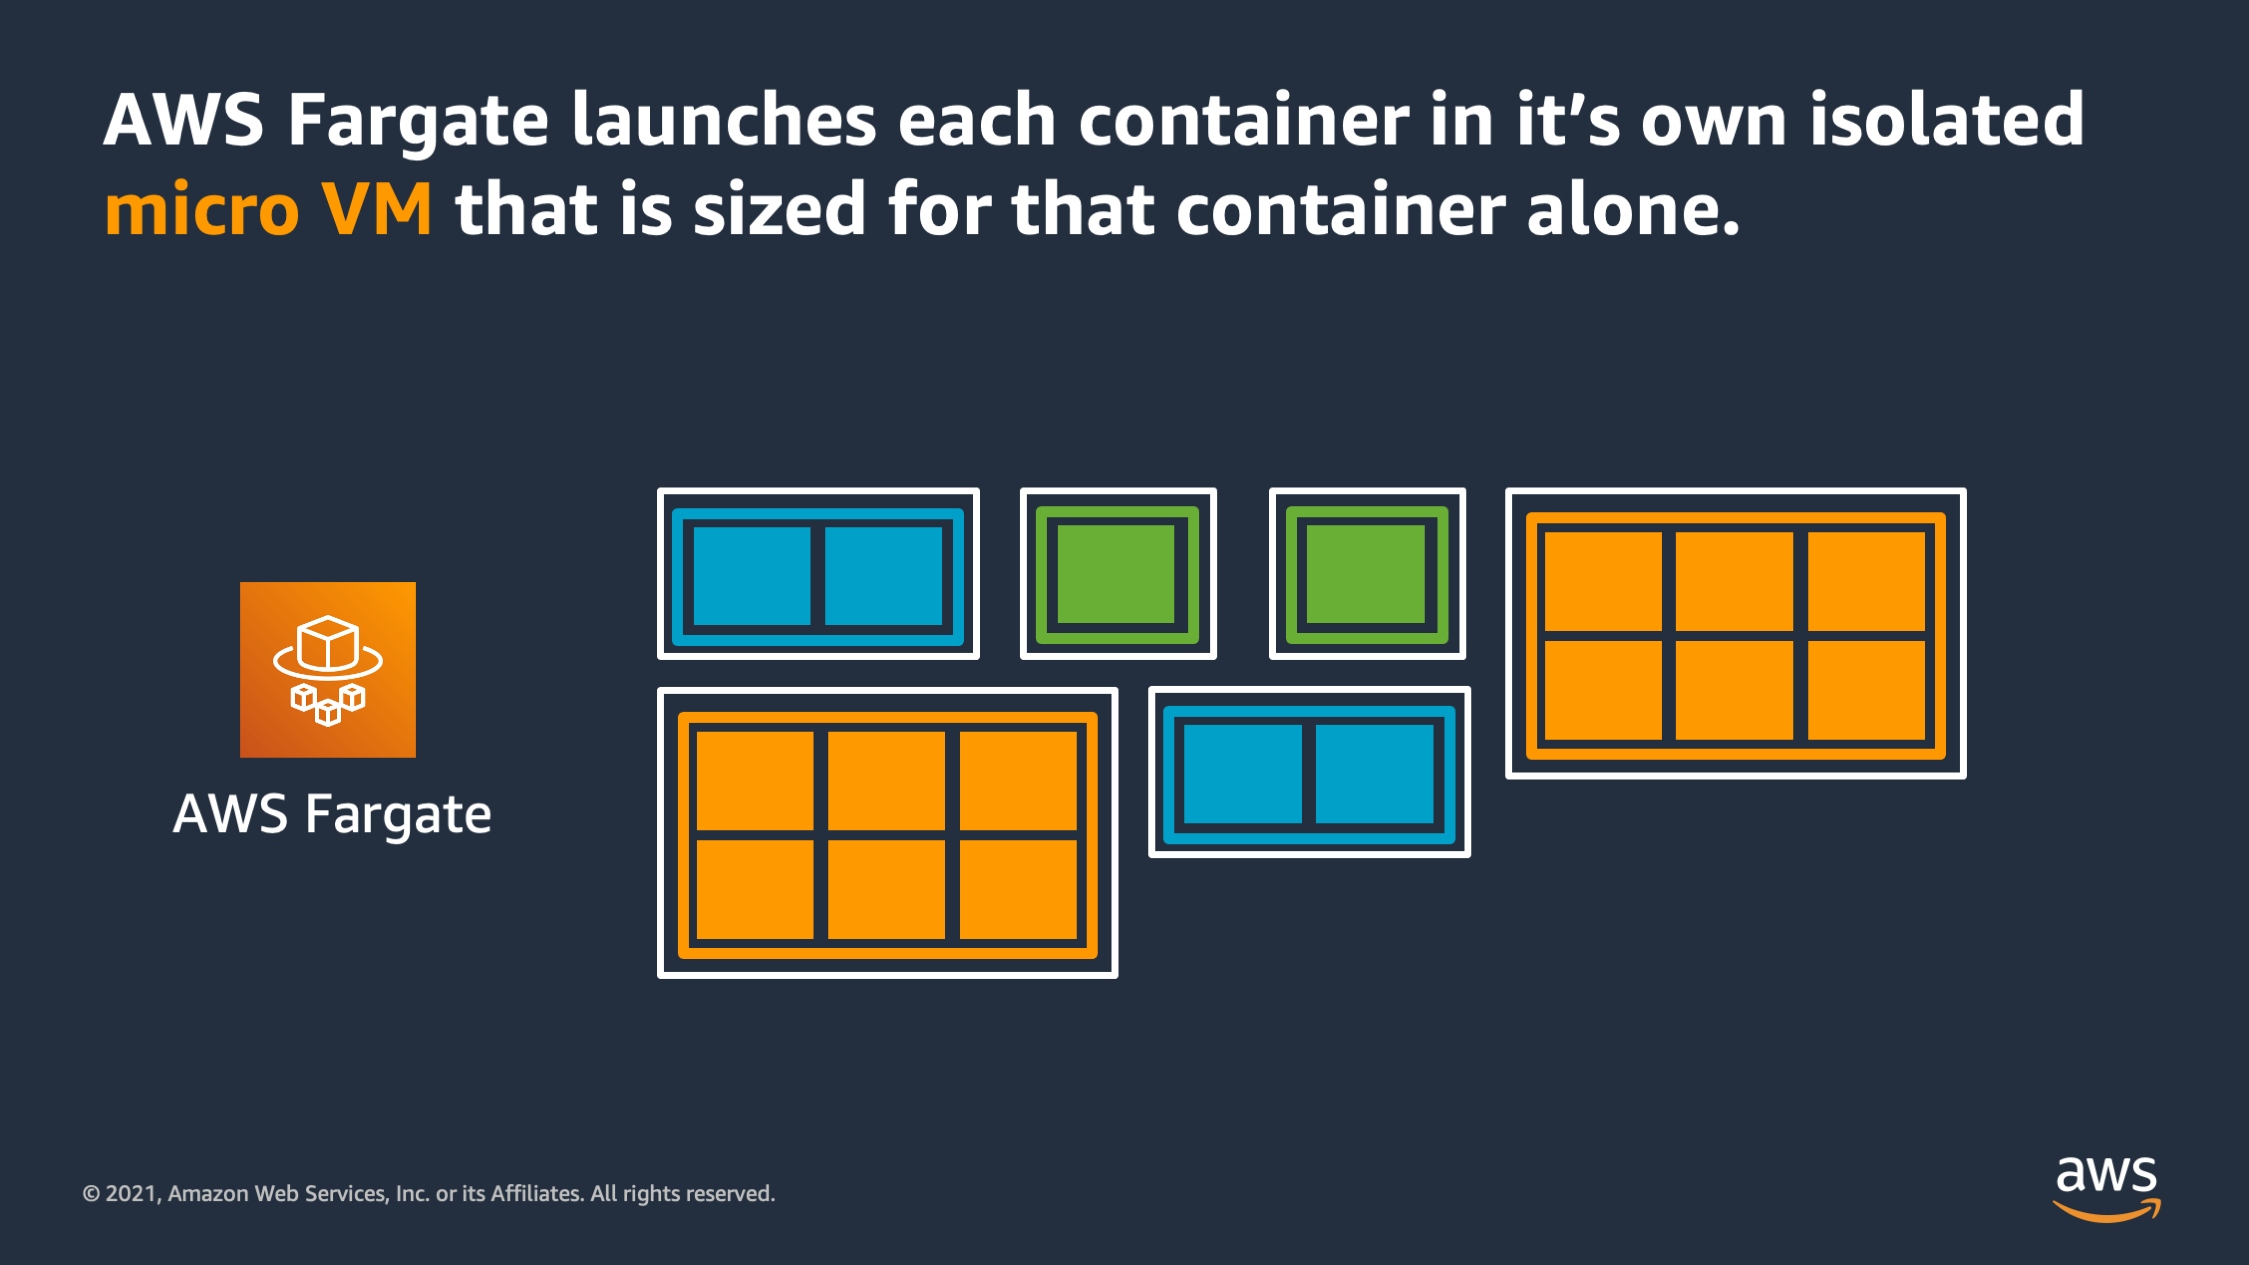
The way that works is AWS Fargate launches each of the containers that you want to run into it’s own isolated micro VM. And that micro VM is actually sized specifically for the needs of that container. So you see here, rather than having large EC2 instances that have a larger boundary and multiple applications within that boundary, each of these containers has it’s own micro VM that is sized perfectly for that container.
With this new serverless paradigm, and with the existing capabilities on EC2, we have a new way to think about scaling, and that is that you don’t think about scaling in terms of VM’s or EC2 instances.
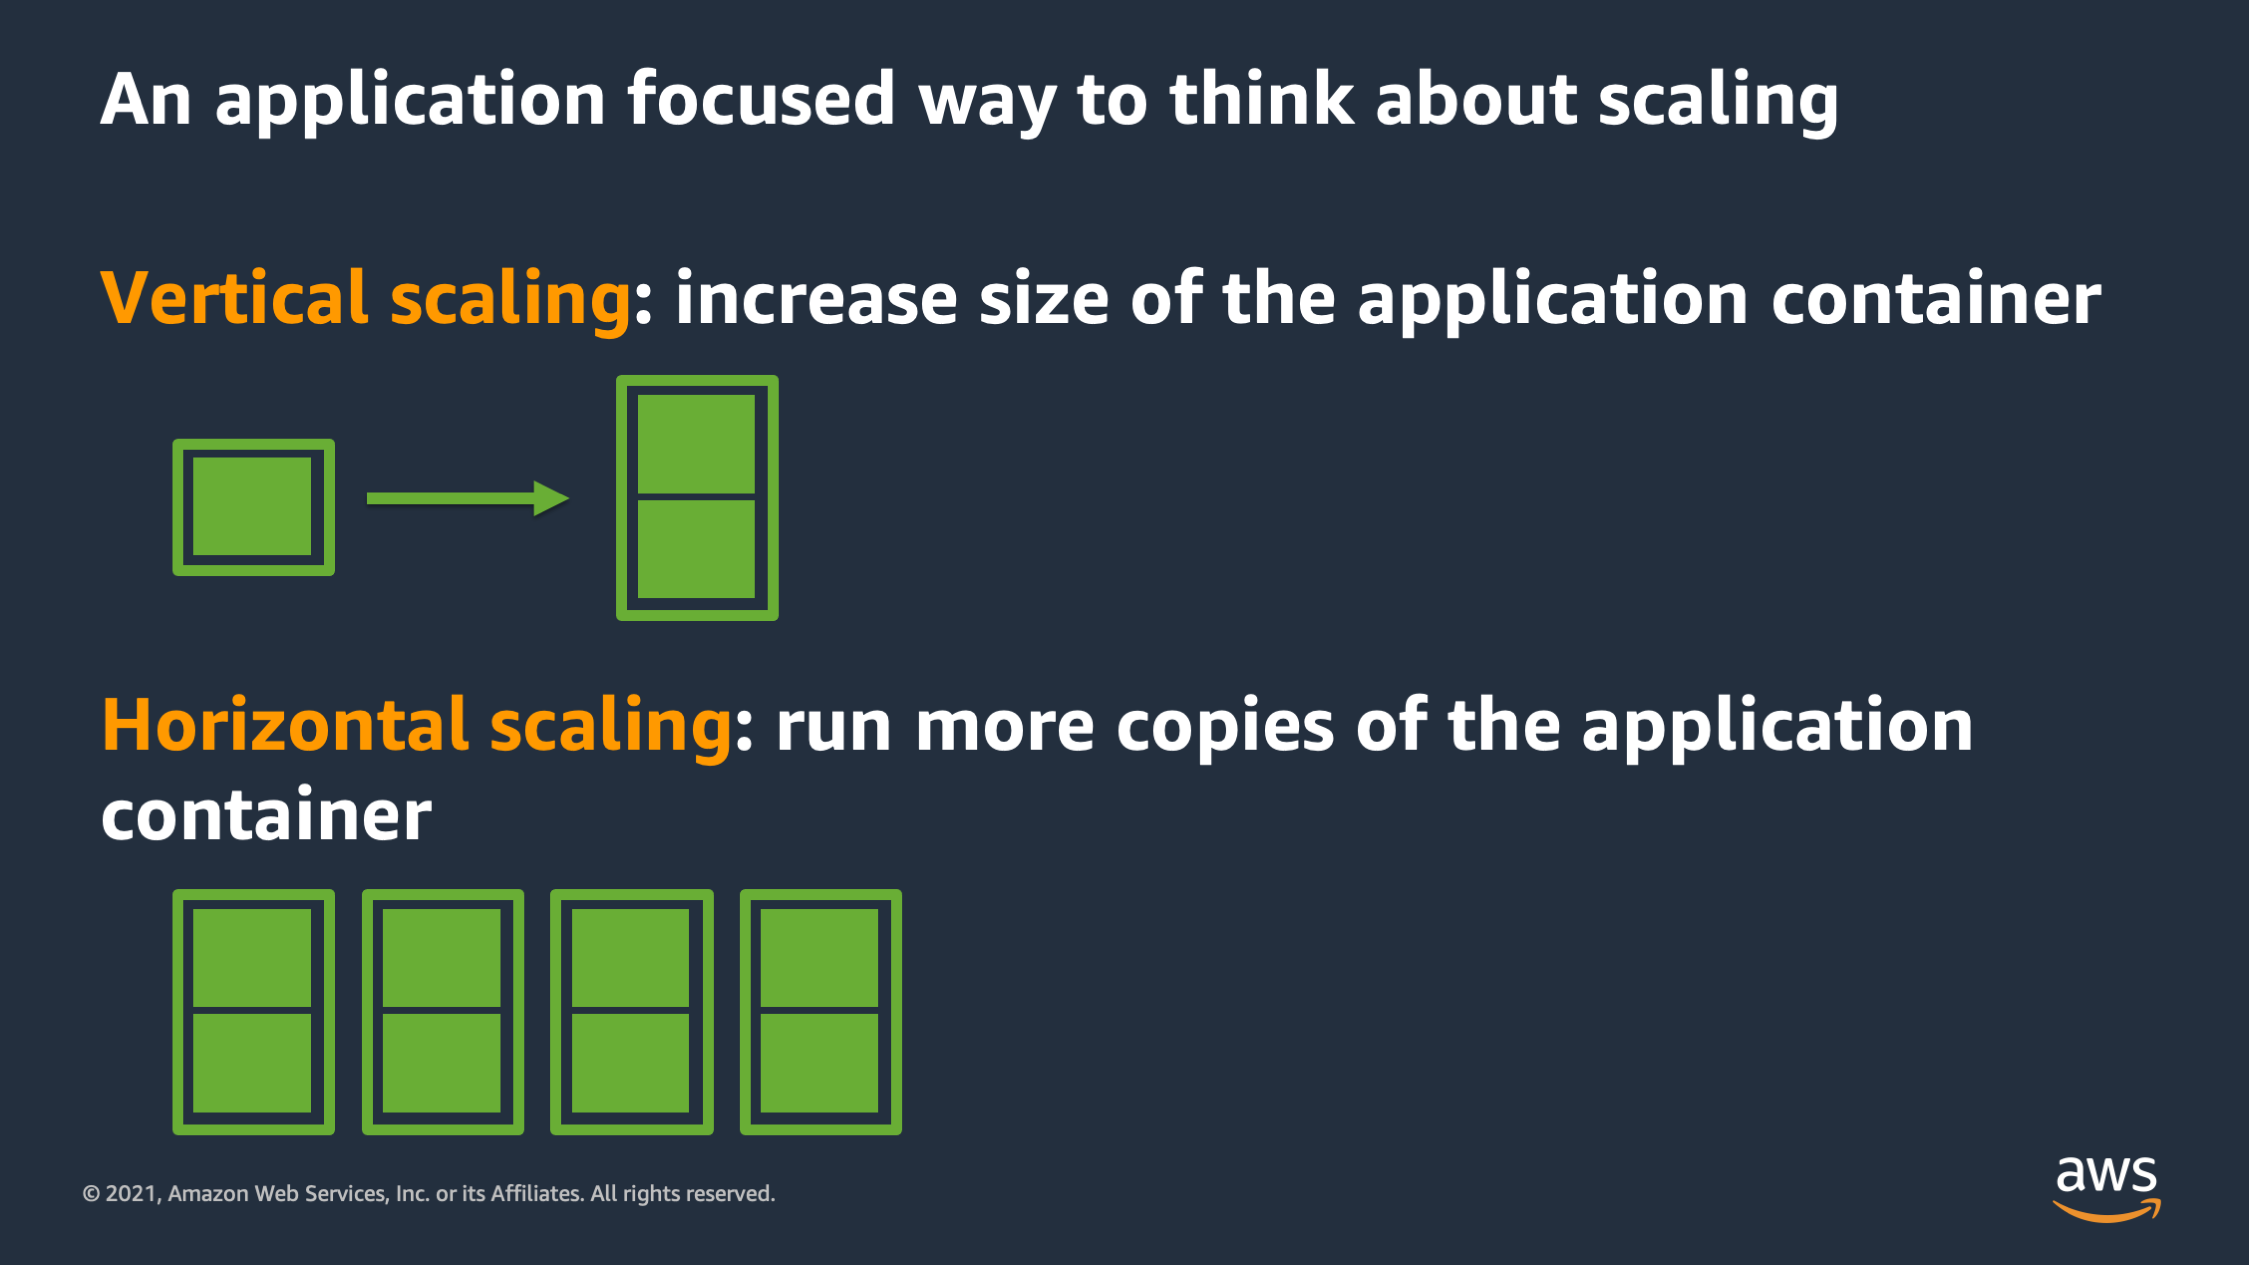
Instead we think about scaling as an application first operation. There are two types of scaling we might think about. The first is vertical scaling. Vertical scaling is when we want to increase the size of an application container to give it more resources. And the second is horizontal scaling. That’s when you want to run more copies of the application container in parallel, in order to do more work. In general, vertical scaling will allow the application to serve a request faster and horizontal scaling will, in general, allow the application to serve more requests overall because they are distributed across more copies of the application.
We’re going to talk about these two categories of scaling, starting with vertical scaling.
With vertical scaling, there’s two ways to think about it. One way is to think about it as improving the quality of service for that particular container. And the second is: how much work can that particular container get done? Vertical scaling allows you to have more work per application container.
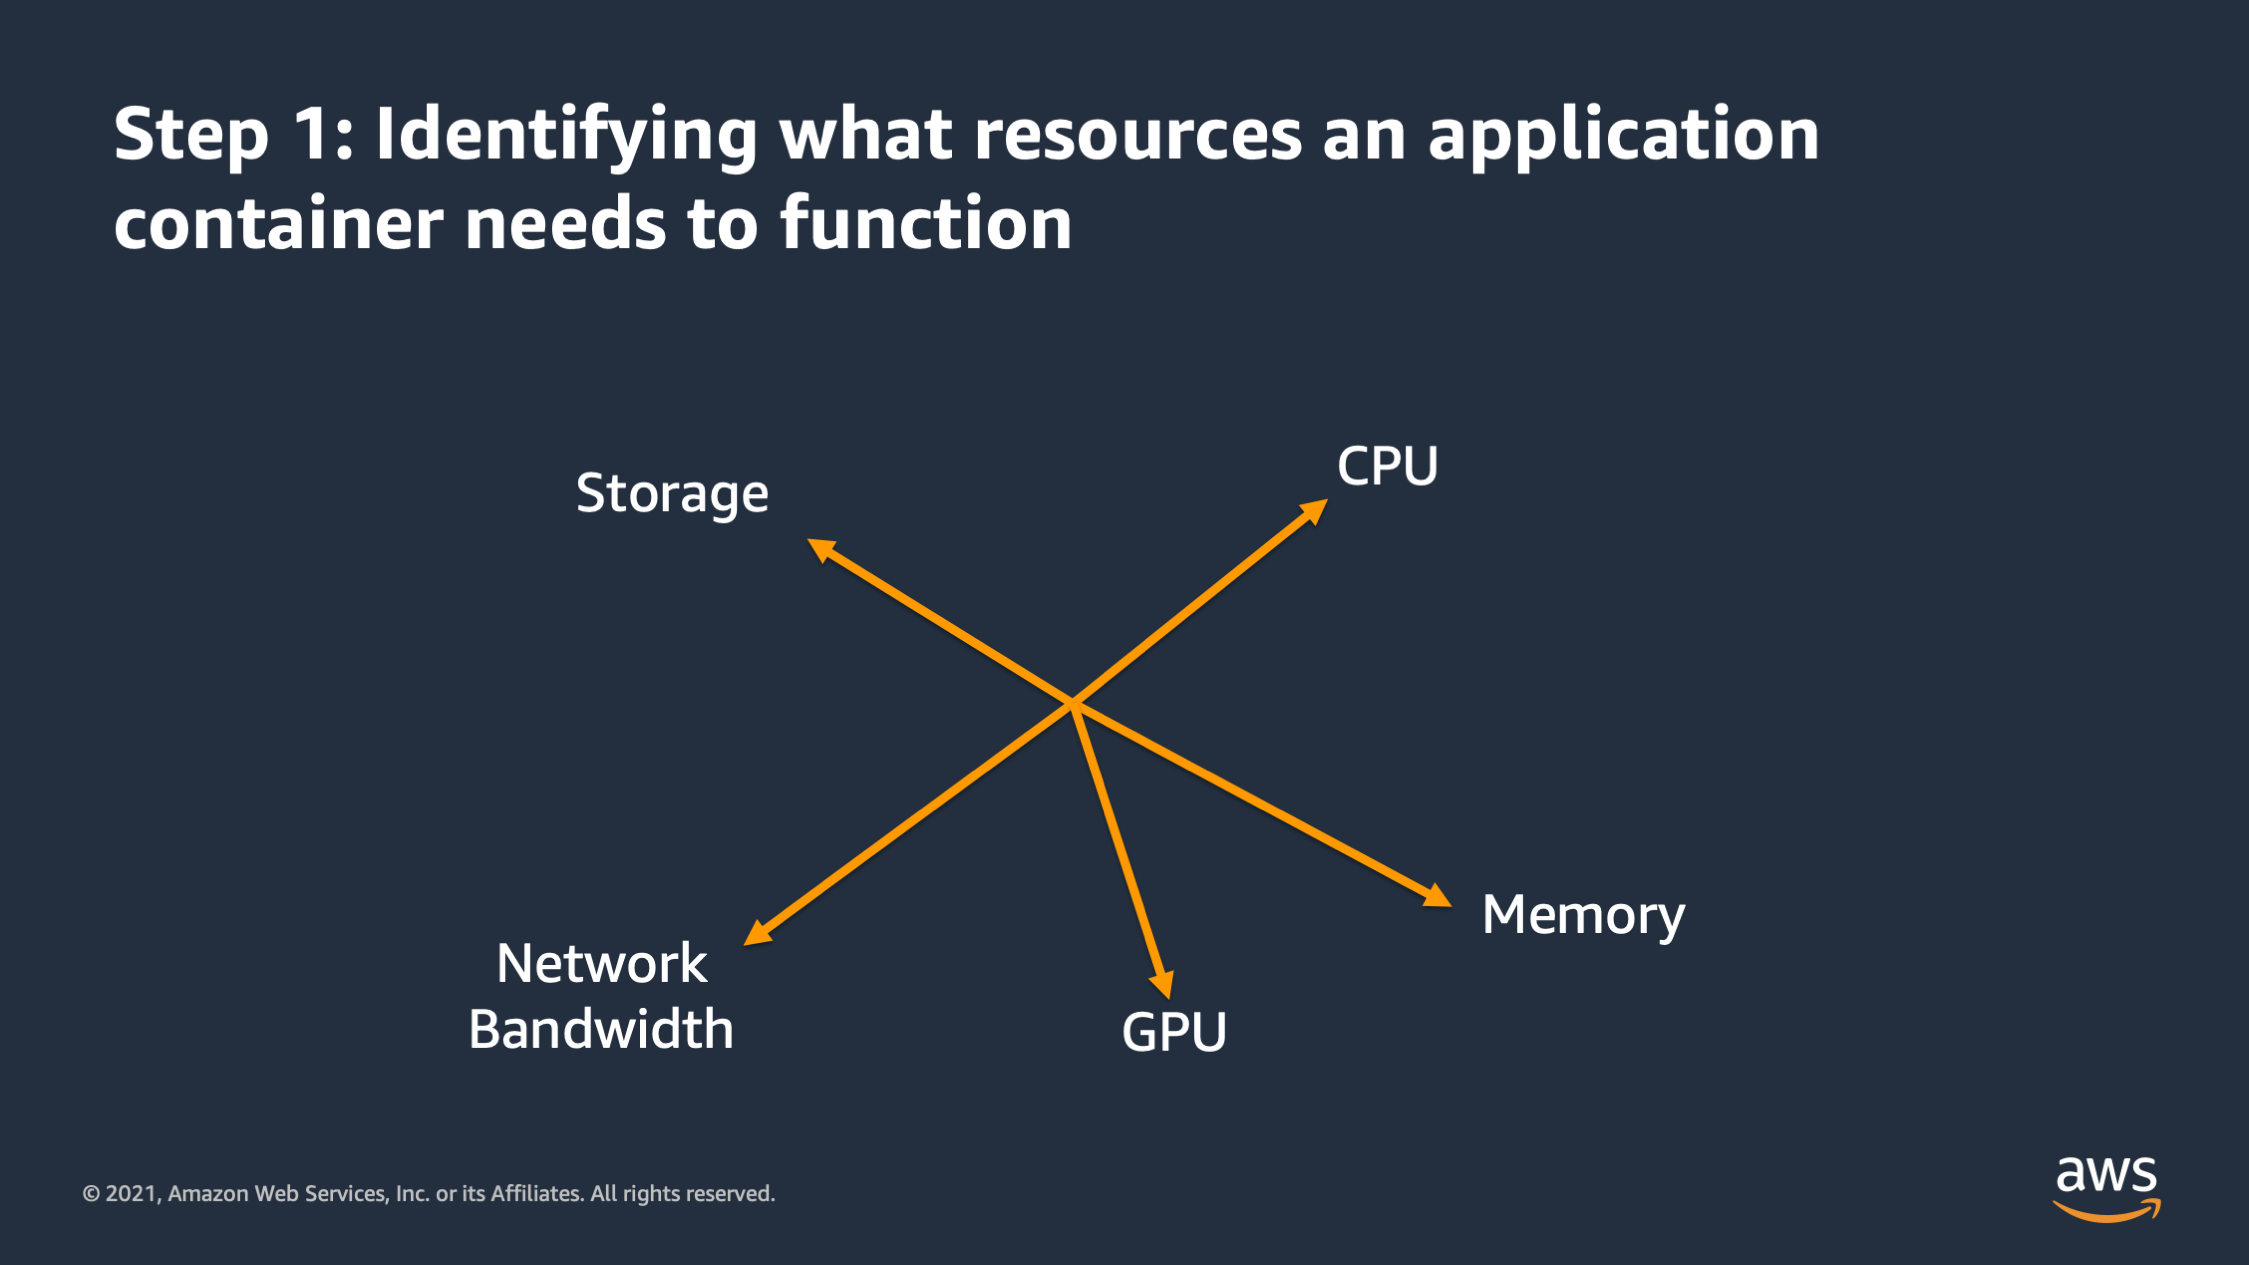
So when I want to vertically scale my application the first step is that I need to identify what resources the application container actually needs in order to function. And there’s different dimensions that these resources might go on. Here, for example, you see CPU, memory, storage, network bandwidth, and some machine learning workloads may actually require GPU as well. So all of these are independent dimensions along which the application may require a certain amount of that particular resource in order to function. So first step is making a list of all of those resources that you think the applications get need in order to function.
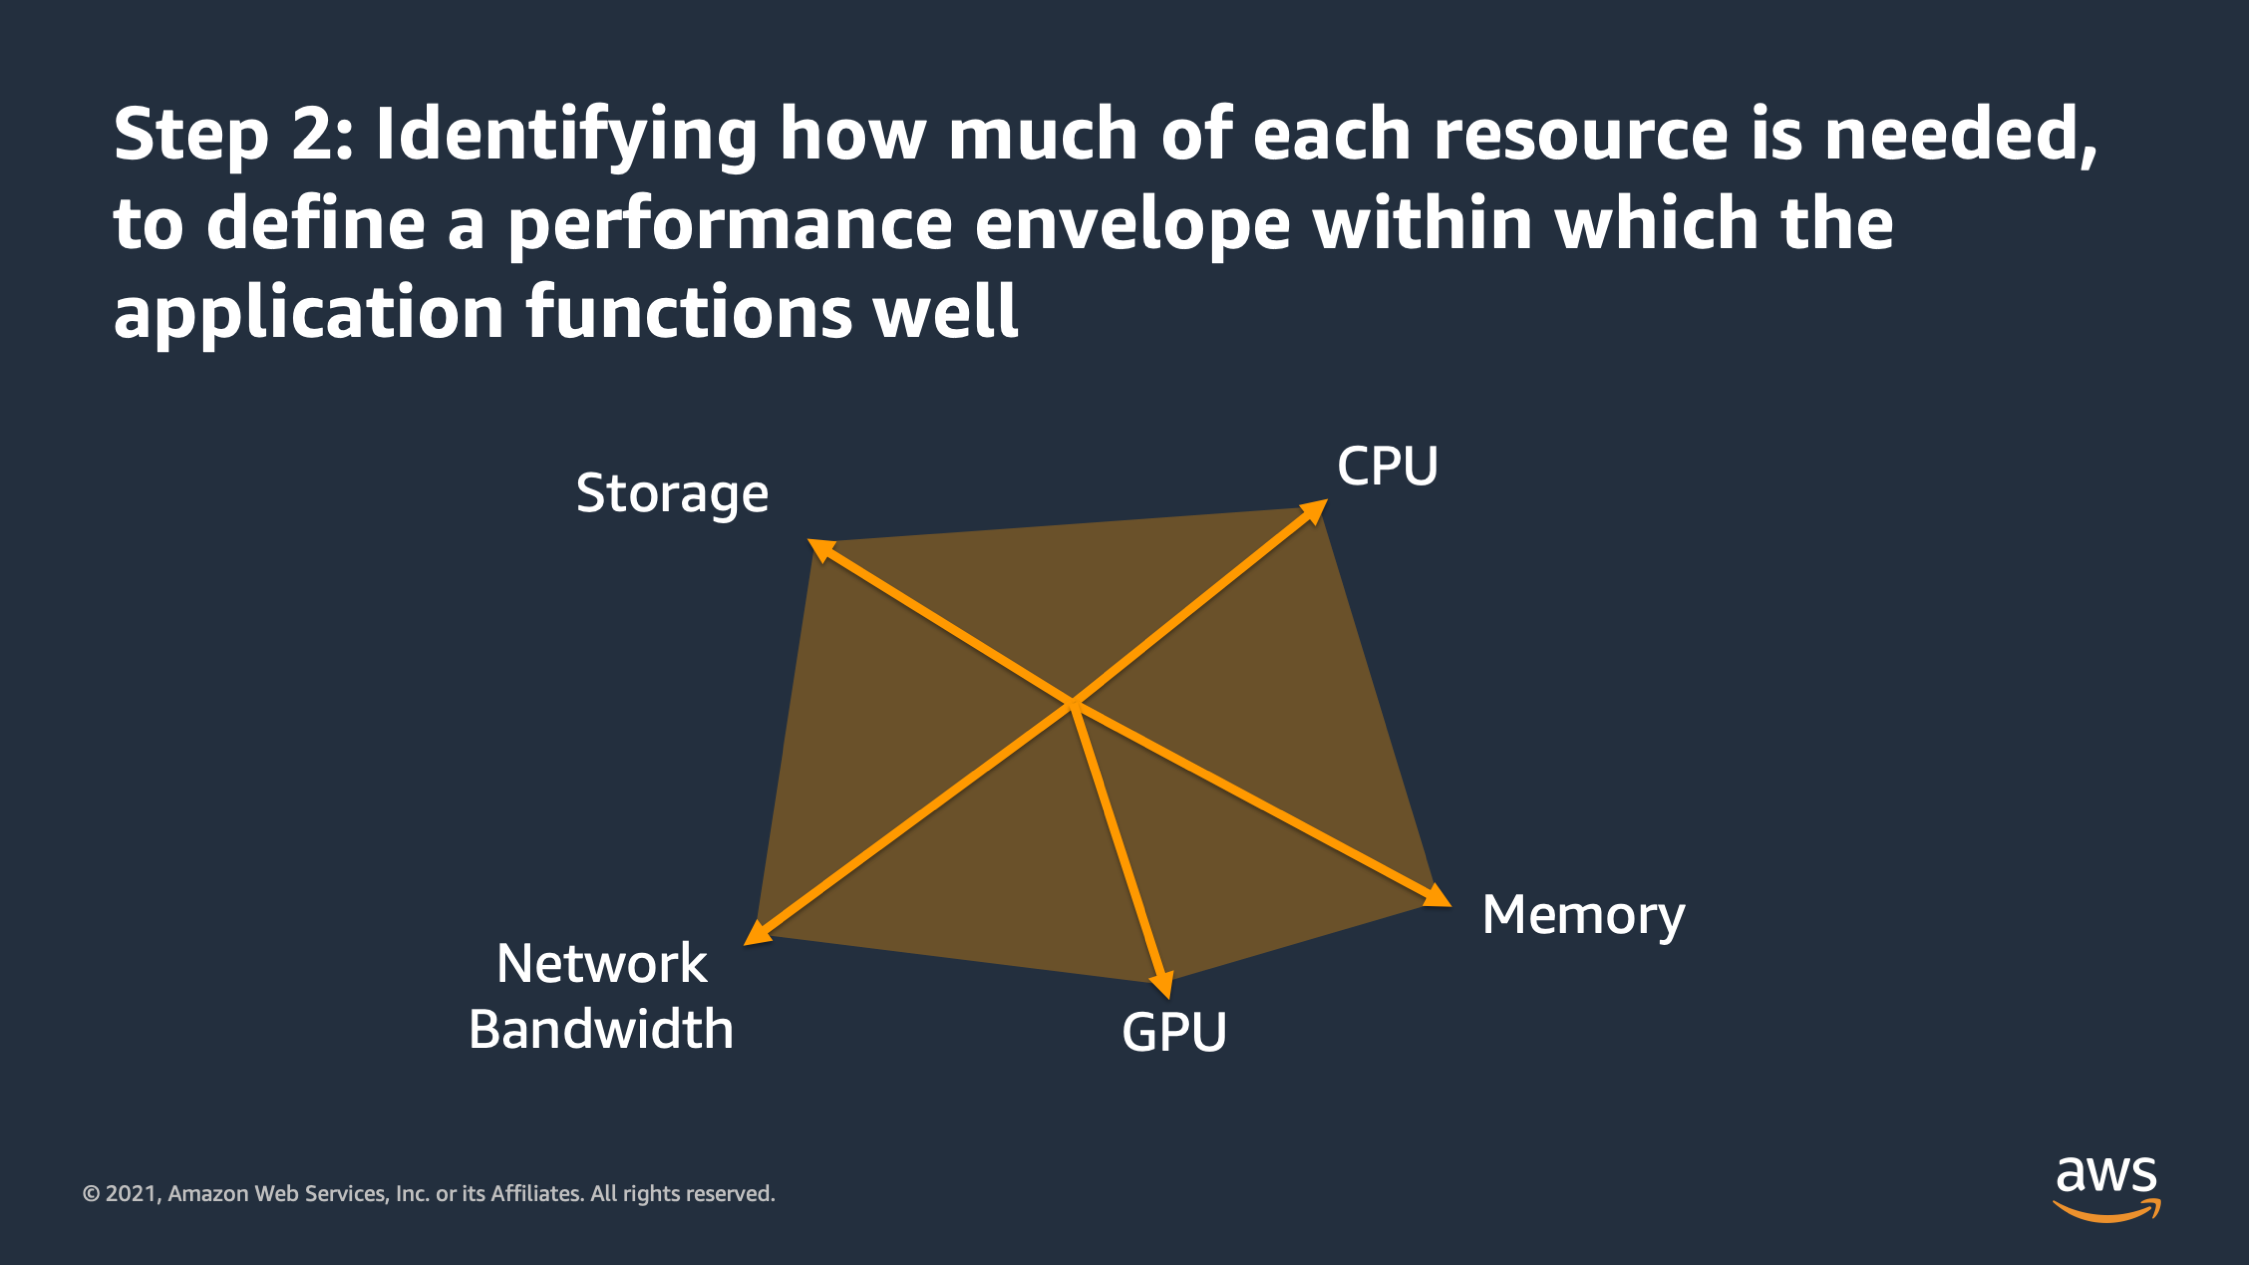
And then the second step is identifying how much of that resource is needed, to define this performance envelope within which you would expect the application to function well. And the goal of that performance envelope is actually to define constraints for the container. With that envelope, we can make assumptions such as: “if demand for a particular resource exceeds the envelope that I’ve defined, then I know application performance is going to suffer.”
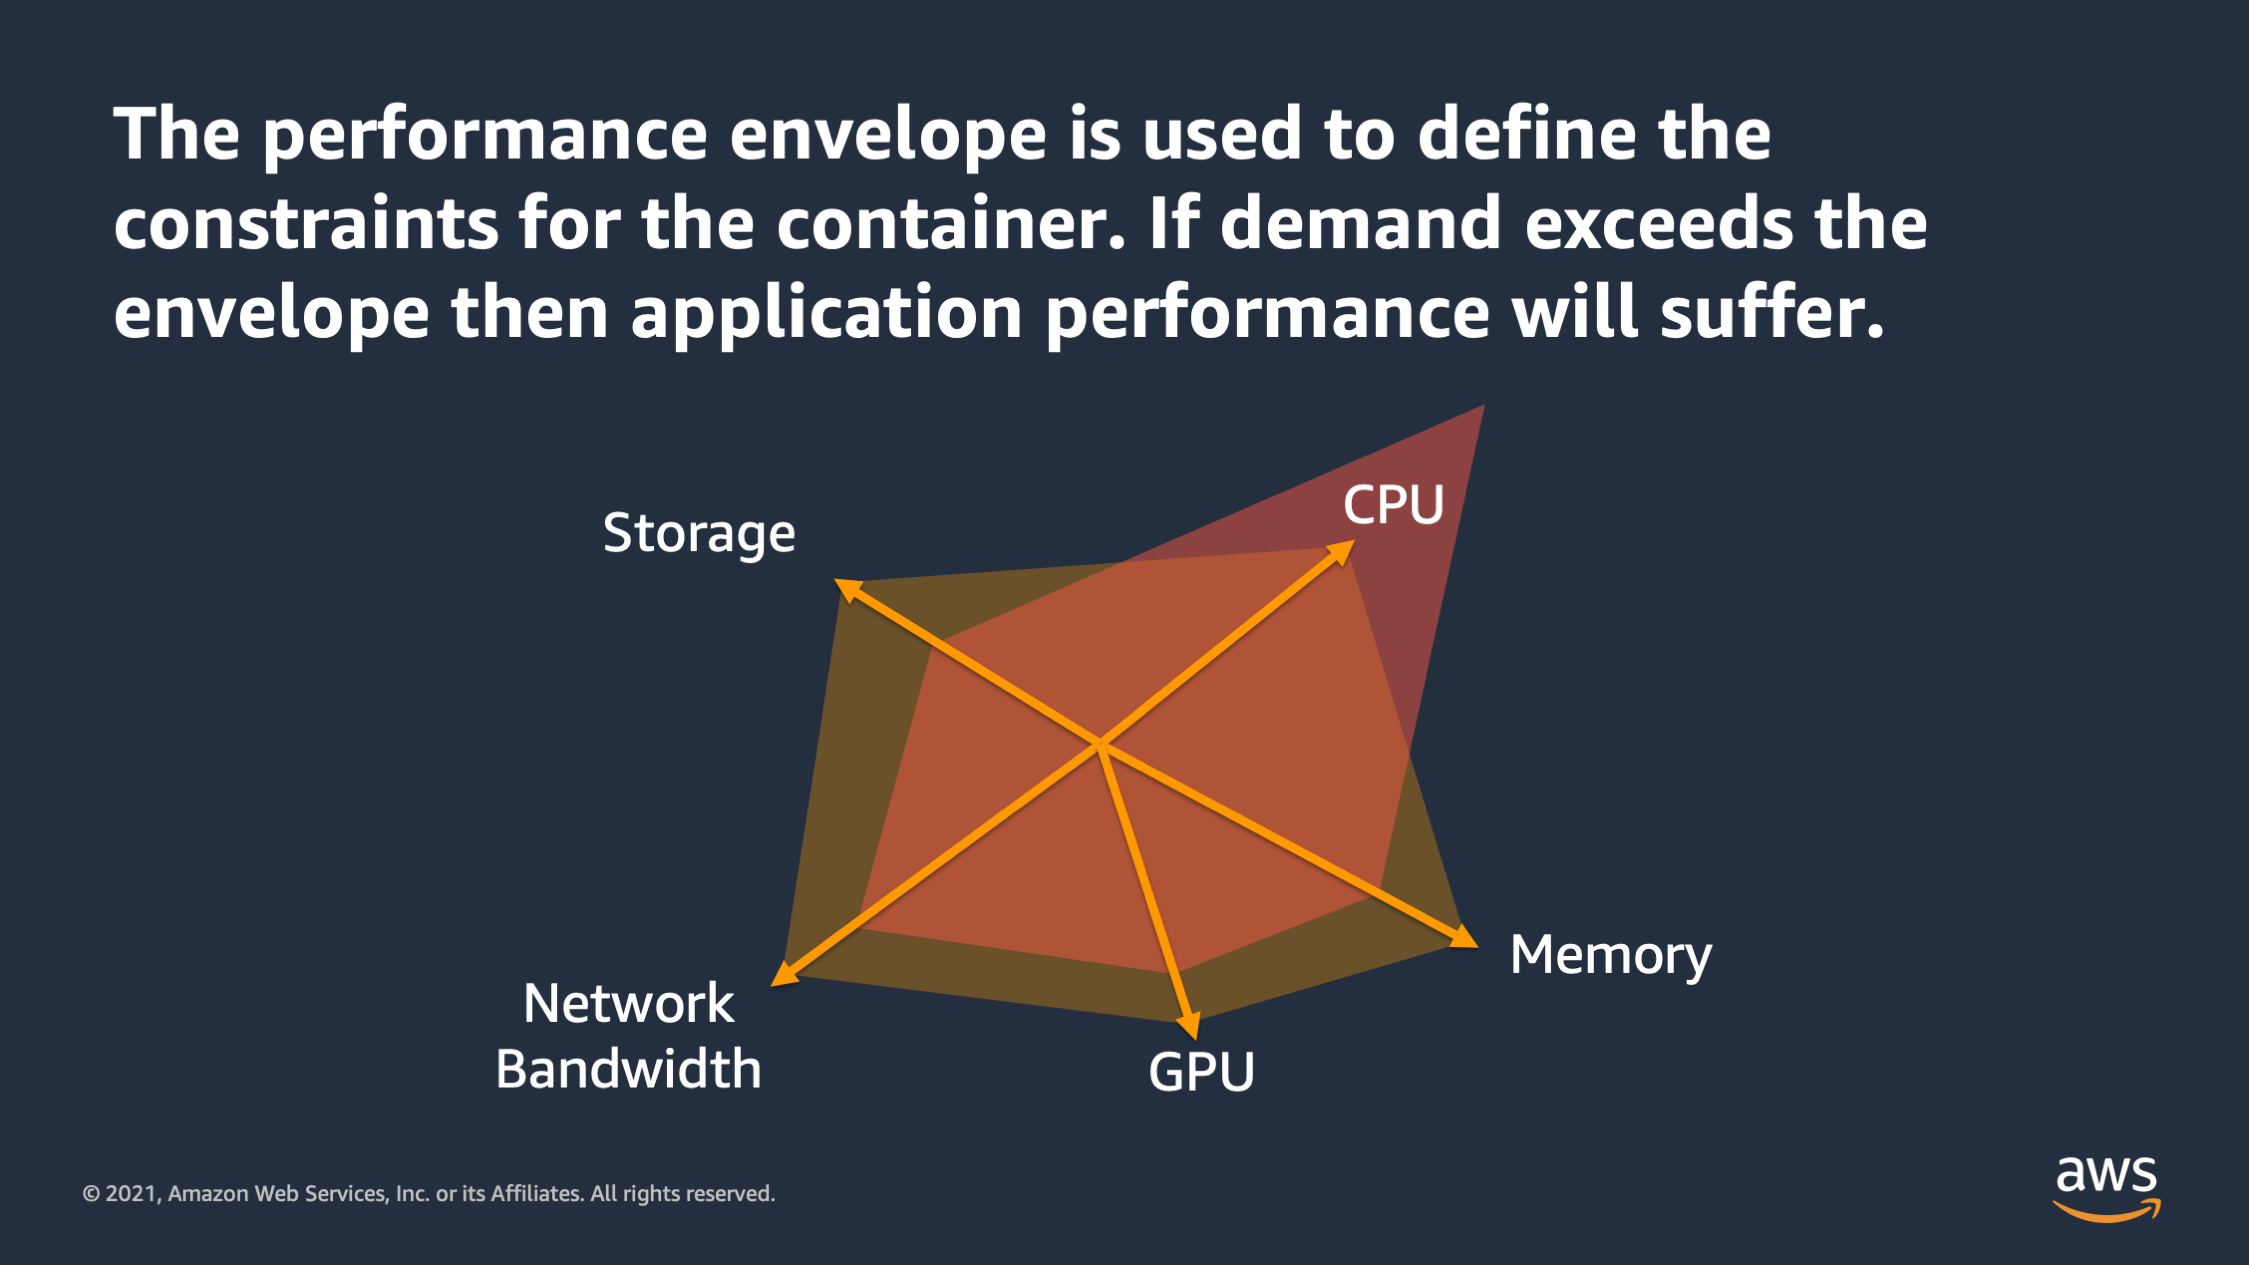
So in this case we define the envelope for the application, but we see that the application’s real demand for CPU has exceeded the envelope it’s outside of the envelope. And at this point I would expect that the application should be impacted. There would be perhaps slower response time. There might be errors. I might see time-outs. Something bad is going to happen if the performance envelope is exceeded.
But how do you actually figure out the right performance envelope for an application?
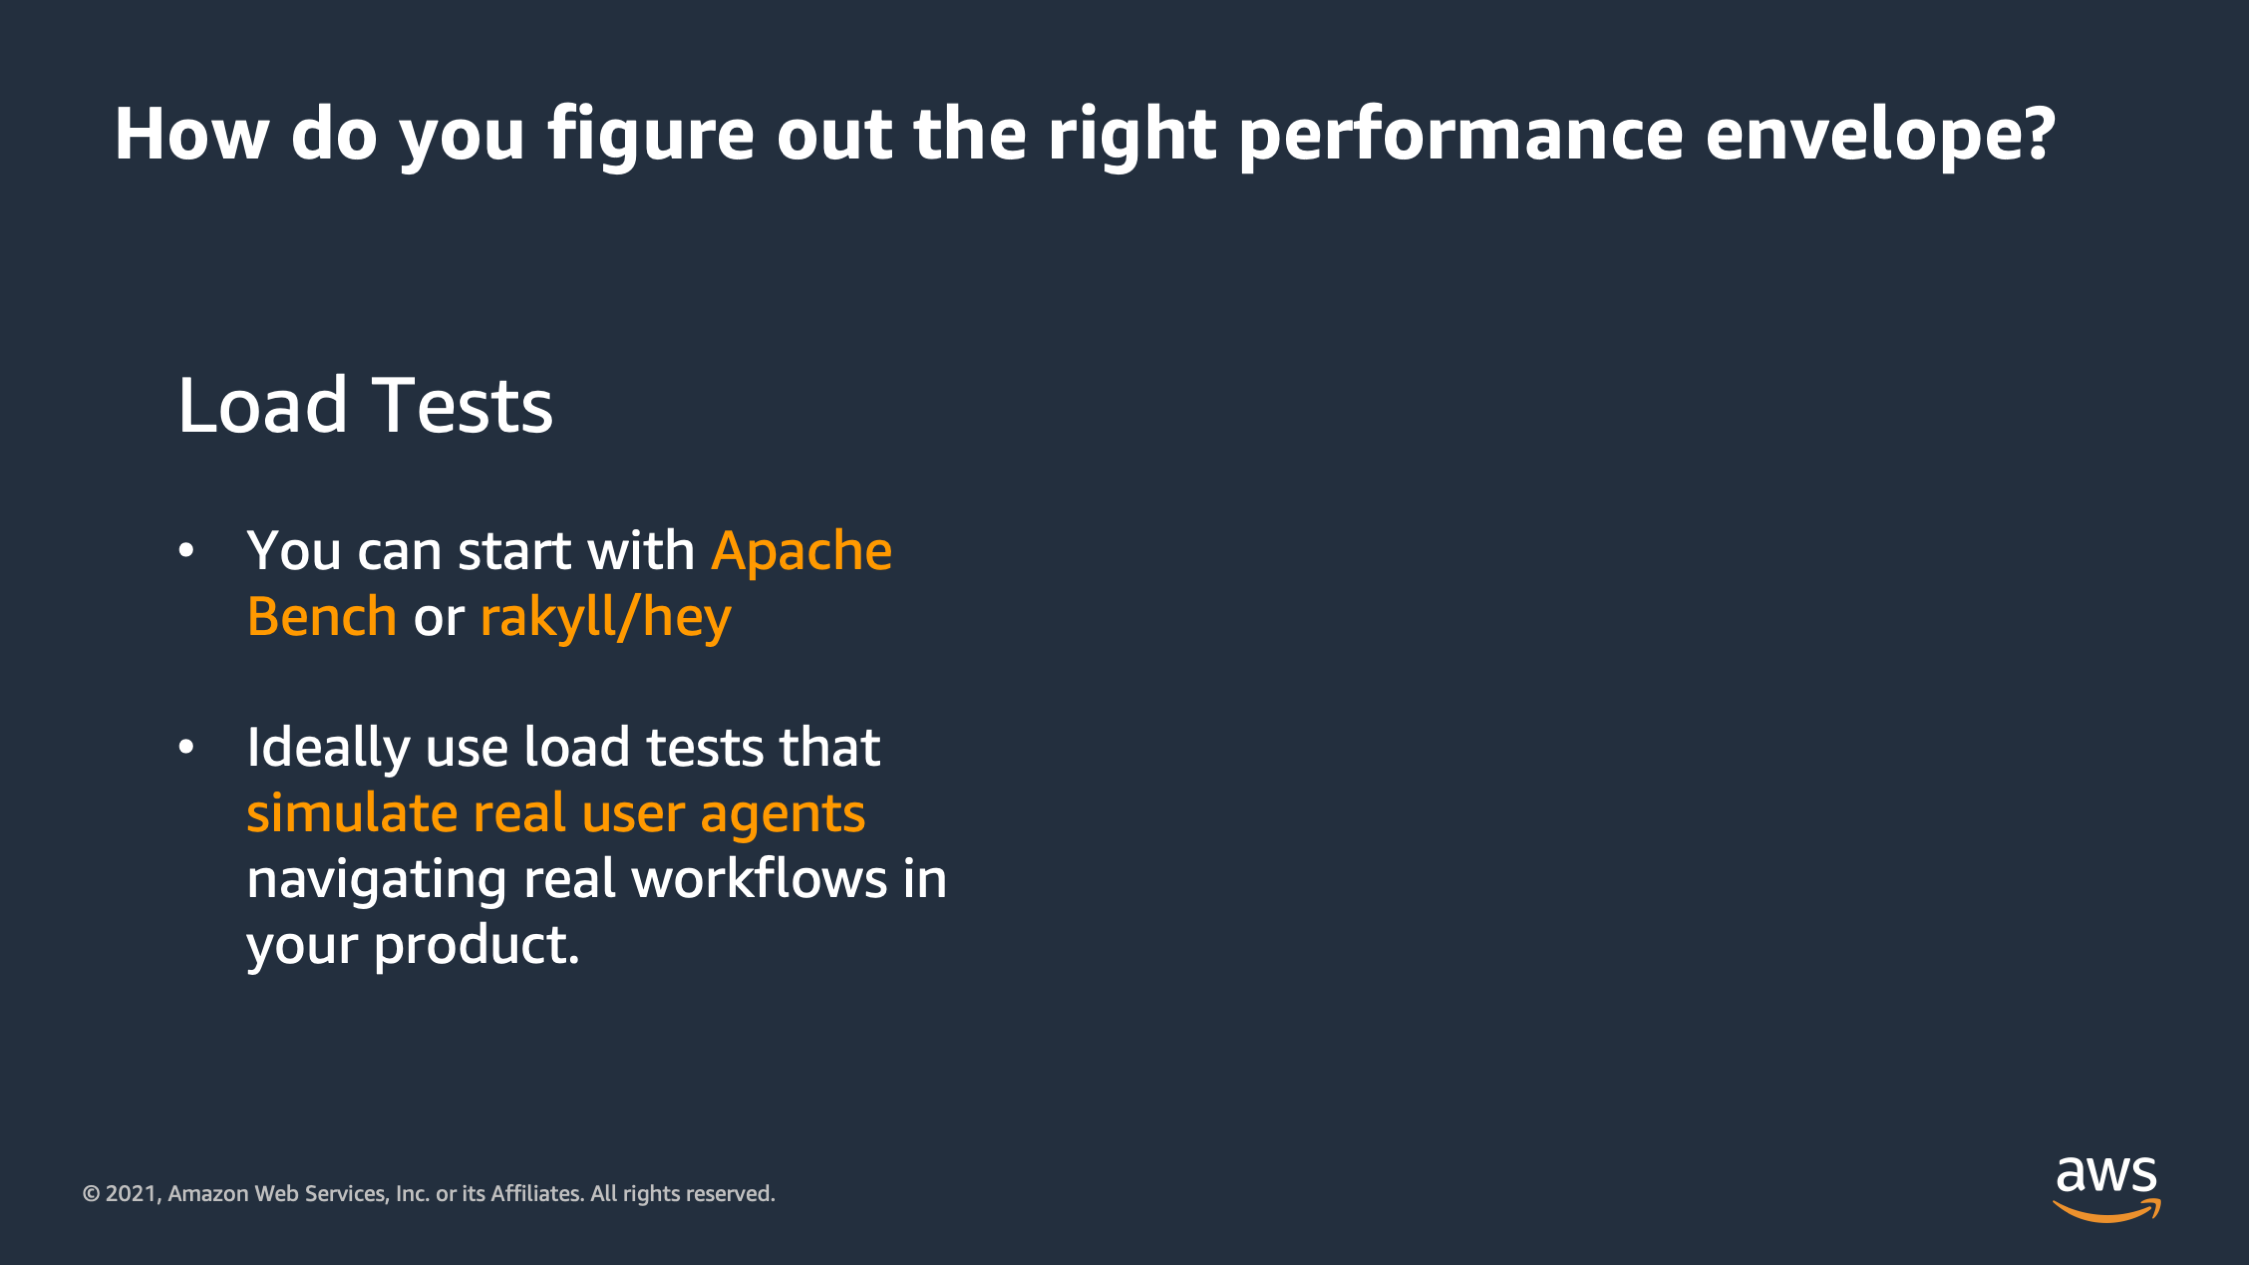
So there’s two key tools that you can use. The first is load tests. So with load tests, what you do is you send requests to your application, and you want to send a lot of them in order to stress the application.
There’s a couple of different levels of load tests that you can use. One thing that I really like to start out with is a simple tool, like a ApacheBench, or Hey. With these tools what you can do is you can just point them at the domain for the application and send HTTP requests to a particular endpoint and measure how many concurrent requests you can send out, and how many requests overall over a certain period of time.
But in the long run, I found that if you really want to load test your application, you need a little bit more than that. You need a way to actually simulate real user agents using your system. And what I mean by that is if you think about how a real user uses a system: they sign up, they sign in, they start creating resources in the system. Maybe they edit things, they delete things. They make real API calls that mutate data, that calls the database. You can’t truly load test the system using plain HTTP request to a web server. You have to actually simulate the real API requests that a user would make.
And so what I found is that load tests work best when you think about it as: “How many of these real user agents can I spawn?” And you create a script which simulates a real user actually hitting the application, doing all the steps that a real user would: from signing up, signing on and making real API calls. And then you see how many of those user agents you can run concurrently inside of your load test.
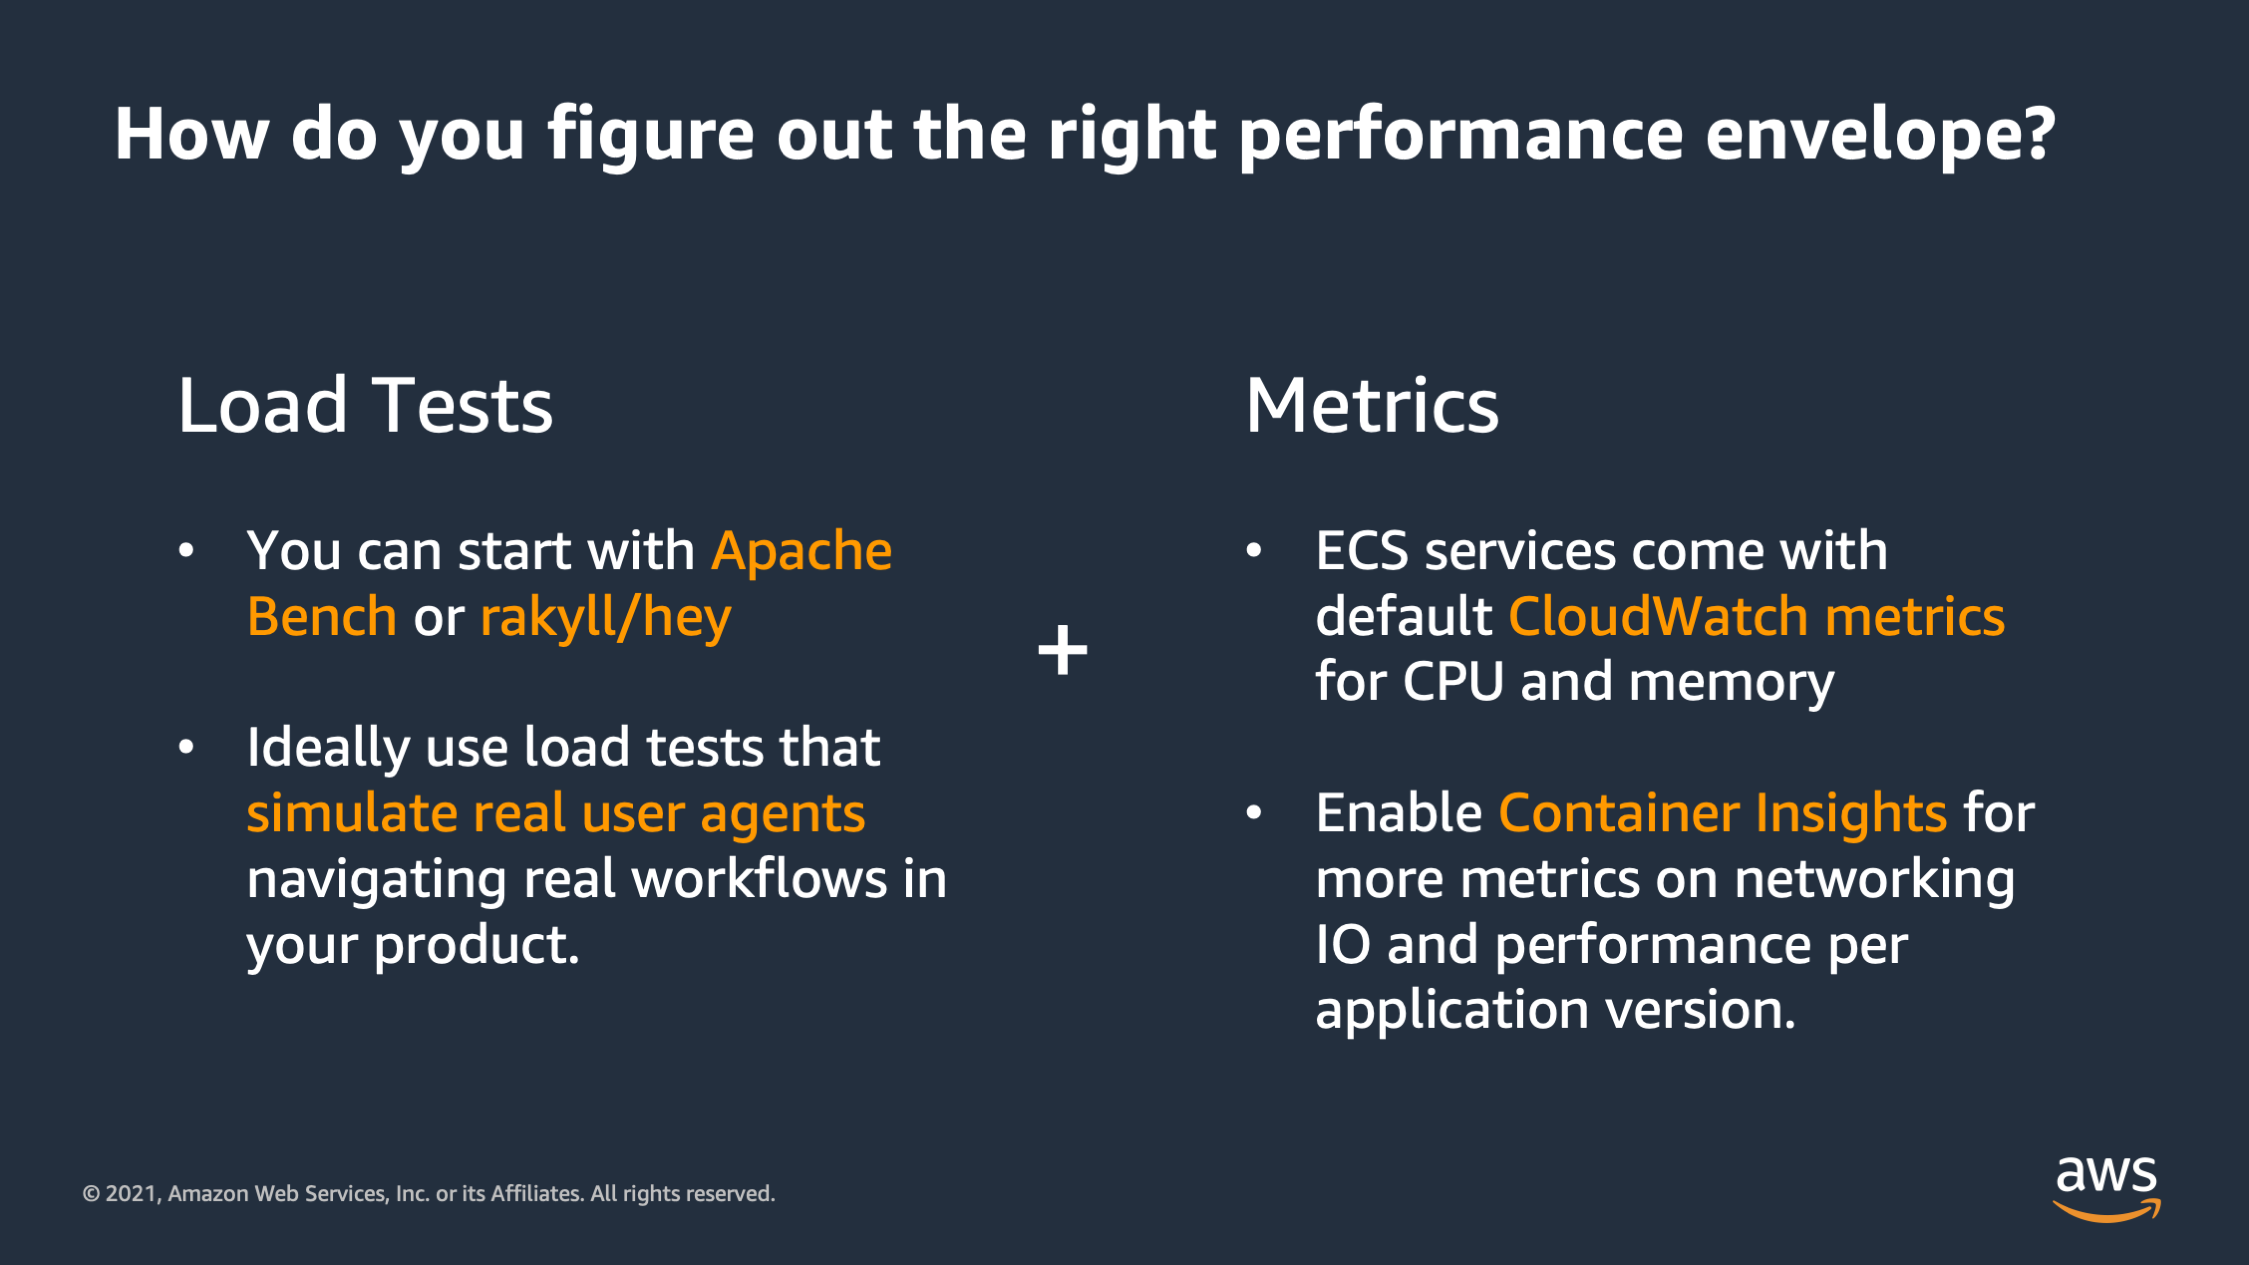
So once you have those load tests started, you need to measure the results of the load test. And that’s where metrics come in. ECS comes with default CloudWatch metrics that you can use as a starting point. It will gather up statistics on how much CPU and memory the application might be using at any given point in time. And you can also optionally enable a deeper level of metrics with Container Insights.
Container Insights is going to gather up stuff like networking IO and you can also optionally add CloudWatch agents to gather up something like disk IO, and any of the other dimensions that you might have inside of your performance envelope. But what you are going to want to do is gather up all these metrics into someplace where you can graph them, especially graphing them over time.
As a load test starts out and the load test ramps up gradually we want to start with a low level of traffic and then gradually increase it to the highest level traffic that we expect the application is probably going to break at and see how those metrics function over time, as the load ramps up to the max.
So when you do that, you’re going to get some interesting graphs that you can use as a learning point to figure out how your application is performing and scaling. Let’s look at some of those graphs.
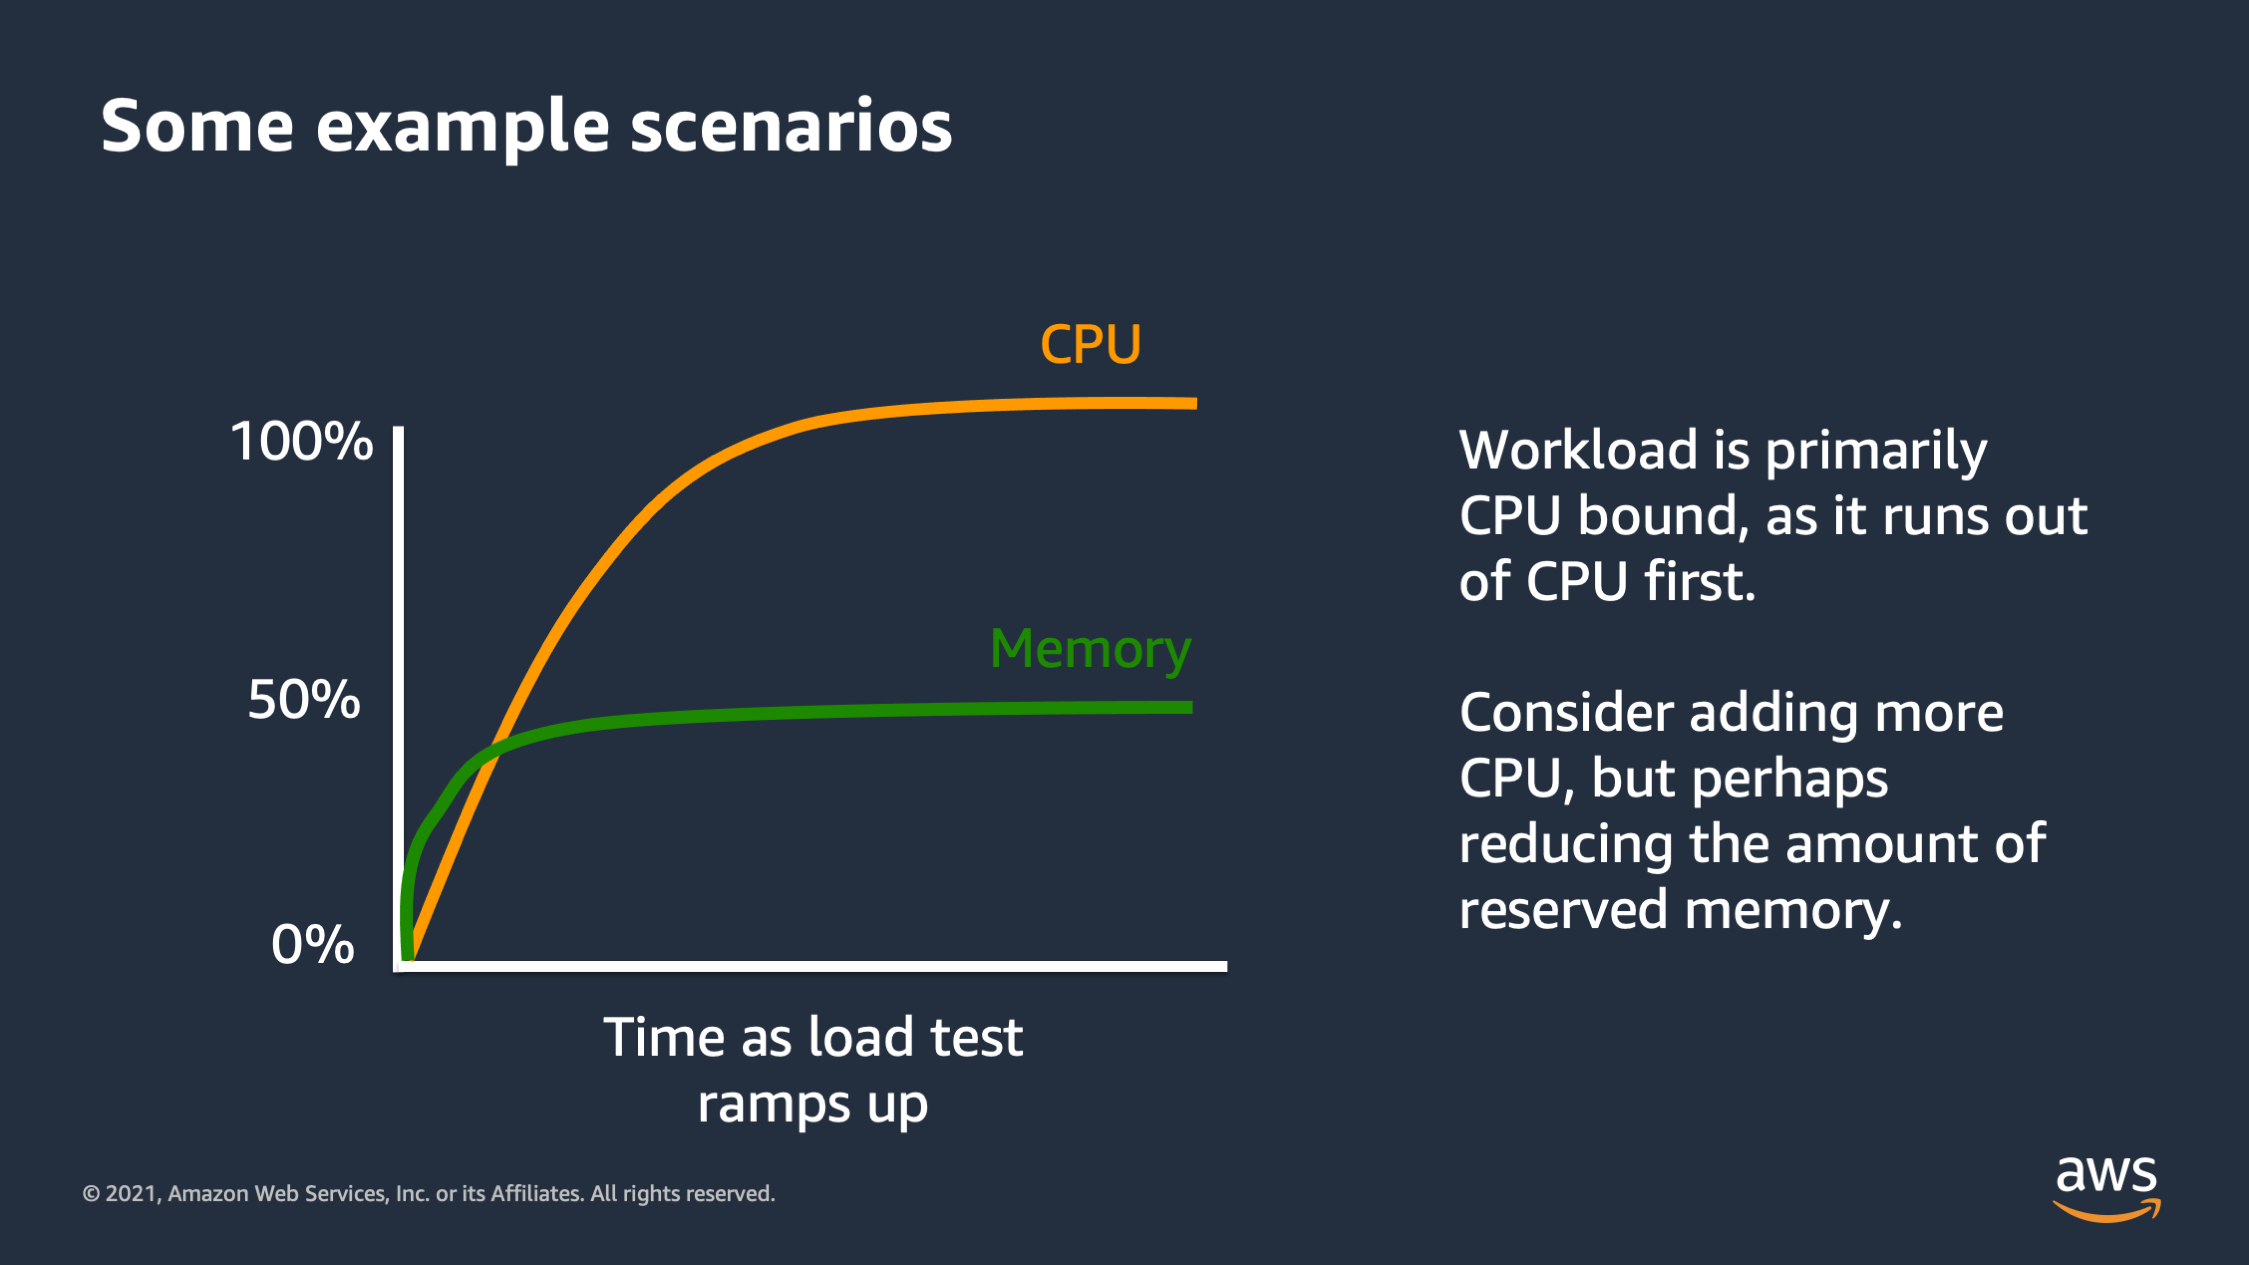
So here’s an example, a graph of metrics over time as a load test ramps up. We can see that these metrics are for CPU and for memory. And we see that one of them is much higher than the other, and it kind of flattens out at 100%.
So that means that we ran out of that resource first. That resource actually reached the max at 100% CPU, that we were actually able to get out of our compute infrastructure and we never max out on memory. So what this is telling us is that the workload is primarily CPU bound. It’s a type of workload that consumes more CPU than it does memory. And so as requests come in, eventually the CPU becomes completely saturated, unable to answer requests. And the quality of the service probably suffers at that point, but we never actually run out of memory.
So this tells us one micro optimization we might be able to make, is considering the performance envelope, perhaps add a bit more CPU and a bit less memory because we’re not actually reaching the point where we’re utilizing the memory as much as we are at the CPU.
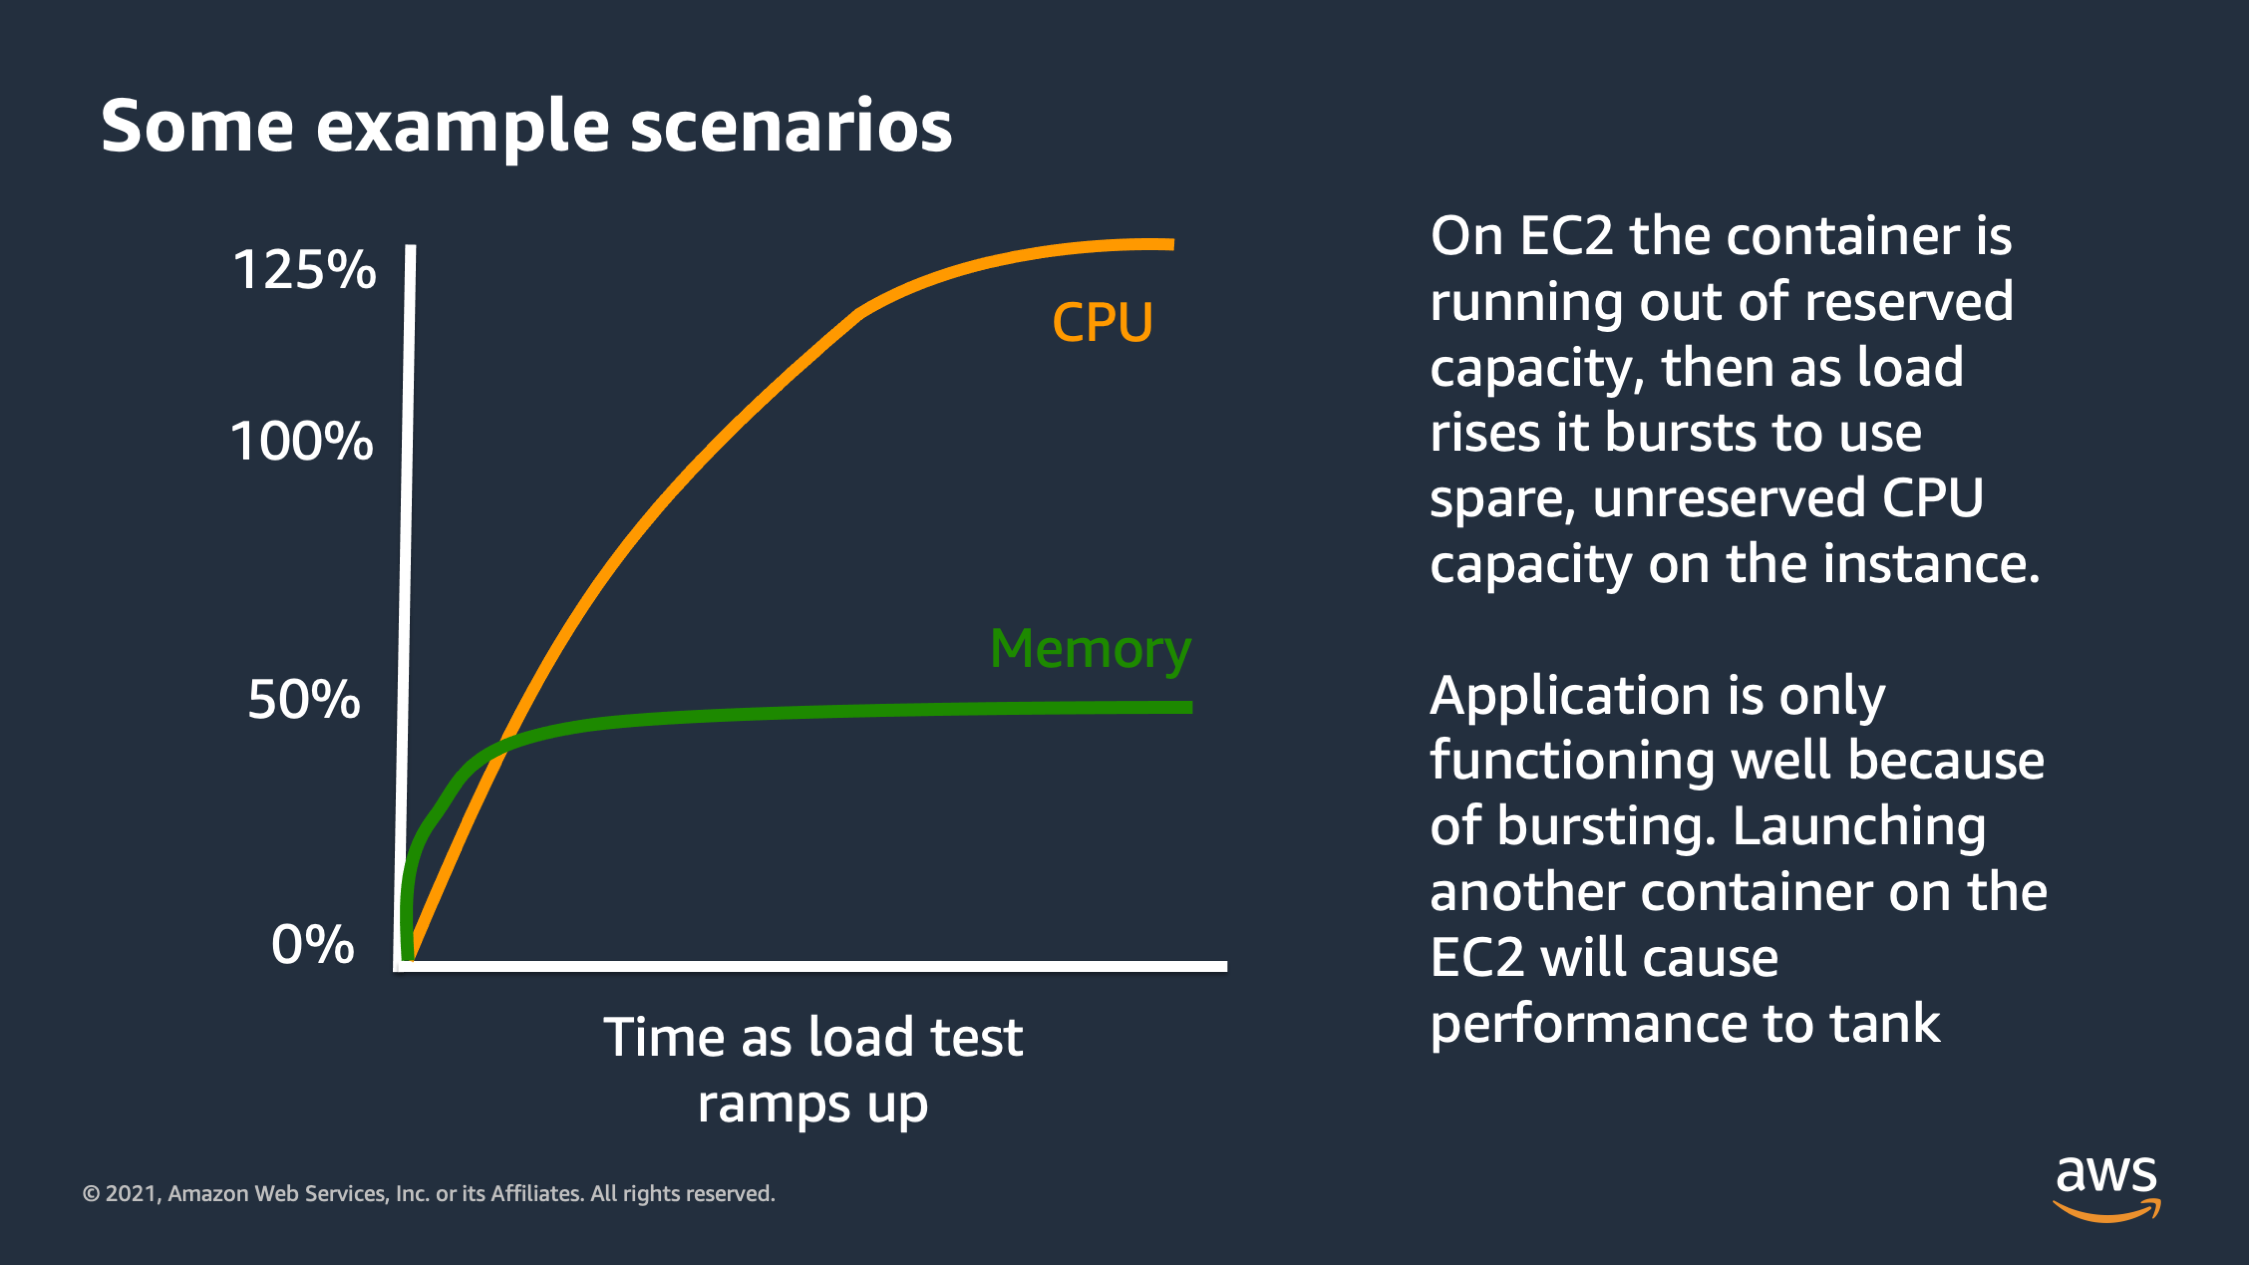
Here’s another type of graph you might see. So this one looks weird. It looks like the CPU is actually going over 100%. It’s going up to 125%. So what’s going on here? Well, this one is actually specific to EC2 instances. You won’t really see this in Fargate, but you will see this if you’re running on a EC2 instance or if you’re running maybe an ECS Anywhere instance on premise.
So by default Docker allows a container to utilize spare CPU capacity on the instance, as long as that capacity isn’t needed for something else, isn’t needed for another application running on the box. So what that’ll show up as is CPU consumption actually going over 100%, up to 125%. In some cases I’ve seen, even in extreme cases, like 400% CPU utilization. Now this is a danger sign, a warning sign, because it means that your application may have been functioning pretty well during the load test, but it was actually only functioning well, because it was using this spare unreserved capacity within the
And what’s going to happen is if you add another application, or if you try to horizontally scale by launching more copies of your application, now there will actually be something that wants to reserve that CPU utilization that is currently being burst into.
And that CPU utilization that is currently being used for burst capacity is going to go away actually. And then the service will actually be forced to go from 125% down to 100%. So this is a dangerous situation because it can actually cause a situation where your performance initially seems to be good but then as you scale, to try to fix a performance issue, your performance will actually tank! It’ll get worse initially as you scale, because of the fact that the service was only functioning properly on burst capacity.
So be careful when you see this. This is a good sign that you may need to adjust your scaling policies to react faster, or to be more responsive to scaling so that way you don’t go too far over into burst territory, because that can go terribly wrong.
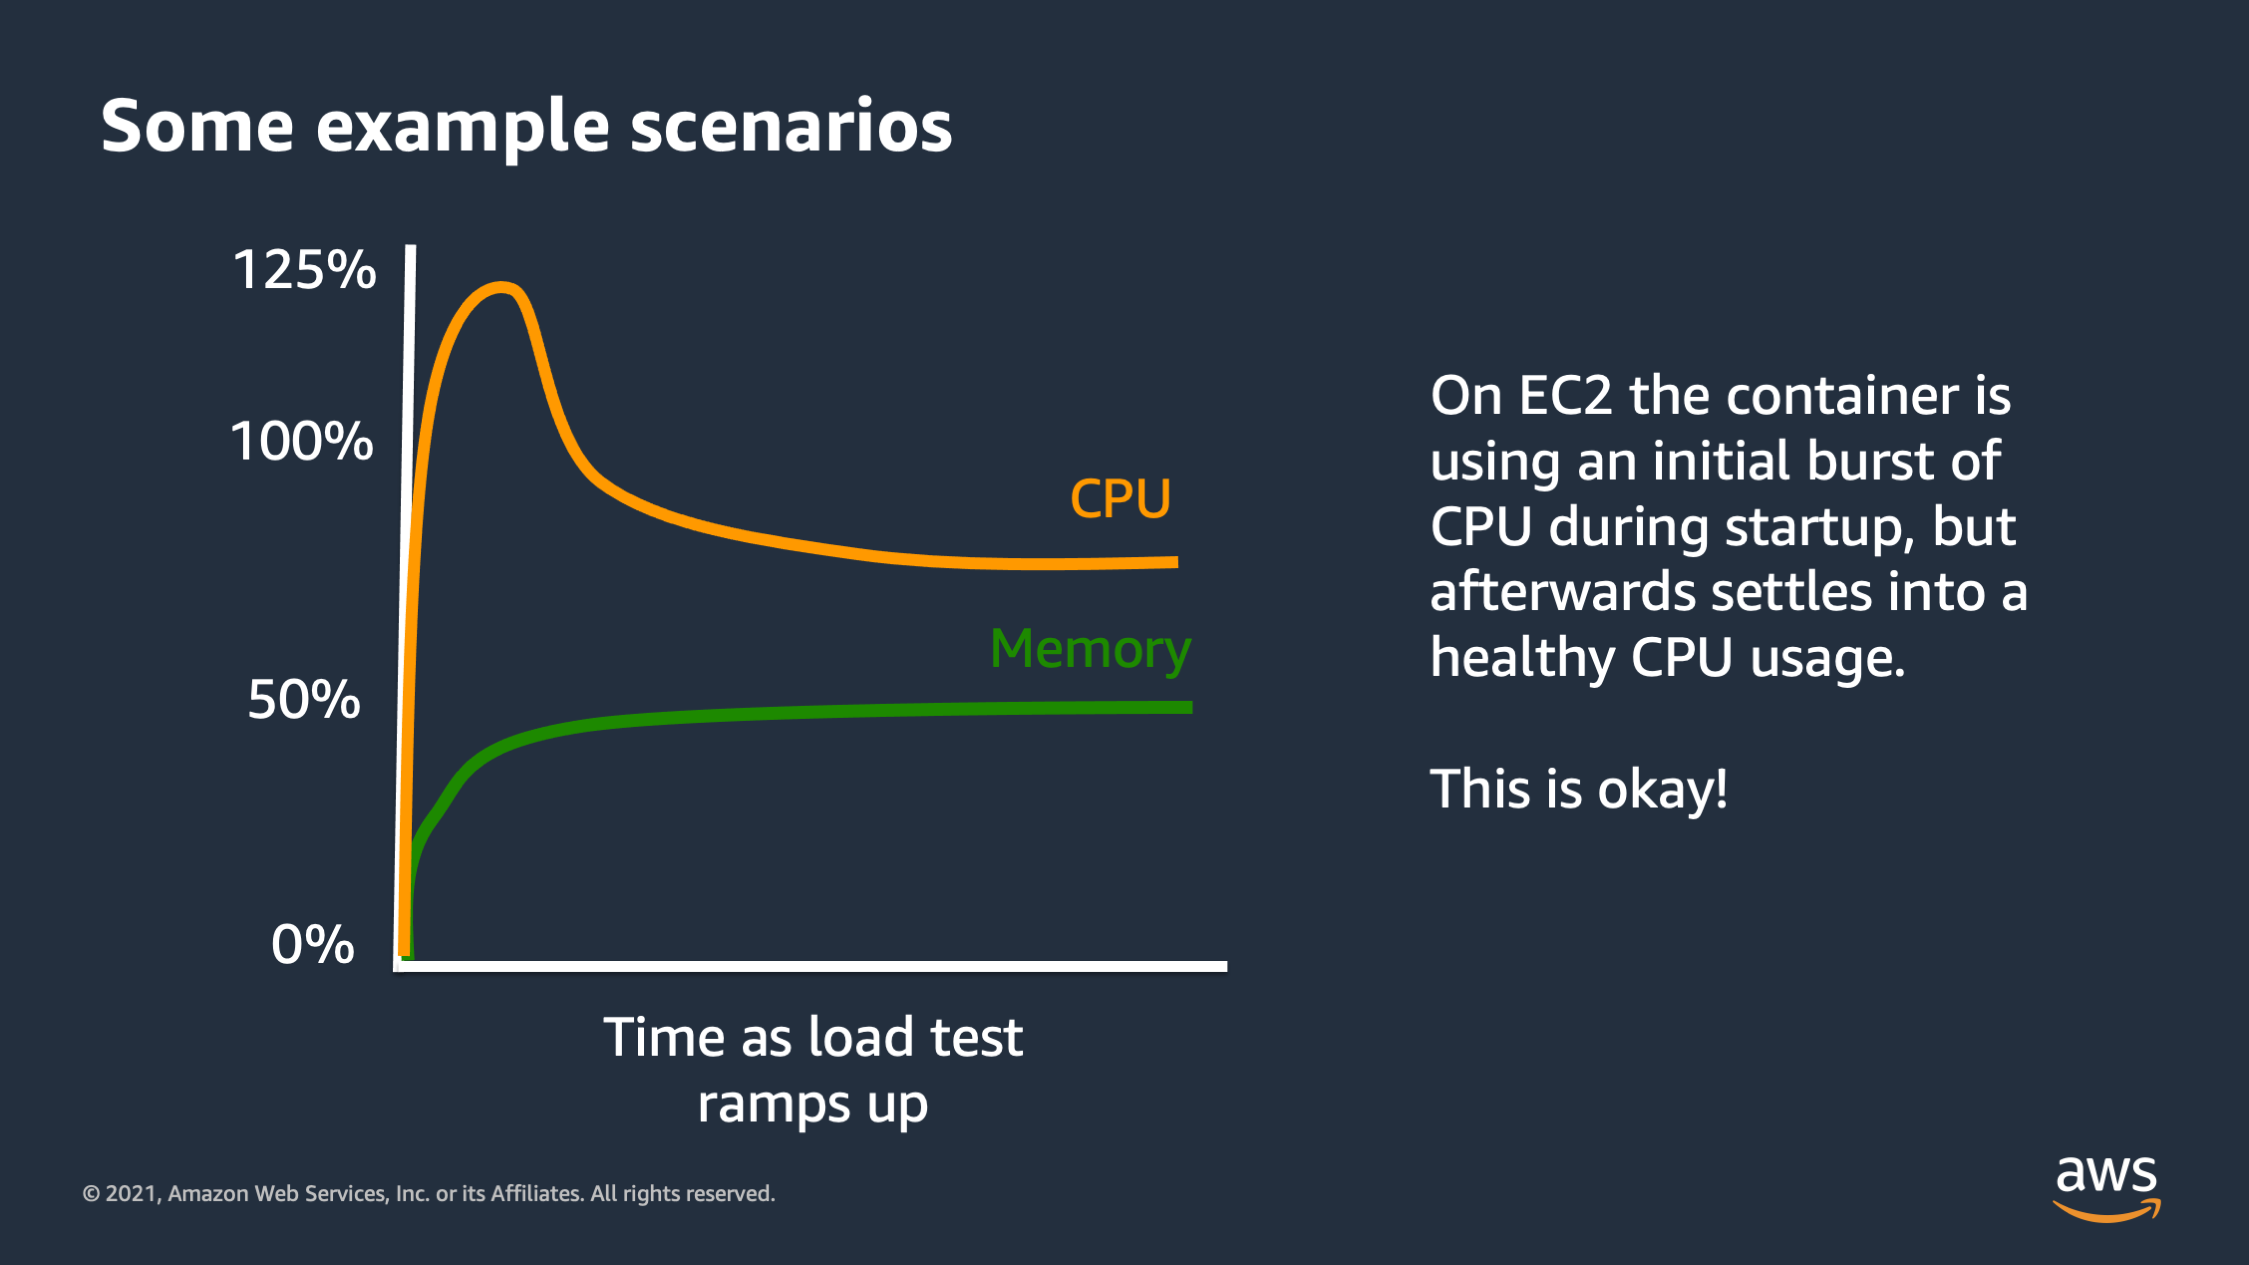
So here’s another type of scenario. This is burst being used properly. So in this scenario, I see that when the application starts up, it needs to do an initial bit of work. Maybe it needs to download some files. It needs to do a little bit of setup work before it can start really processing requests. And so initially bursts the 125%, but then it settles down to below 100%. This is good. This is what I want to see. This is containers using the burst capacity efficiently, but not relying on it for an extended period of time.
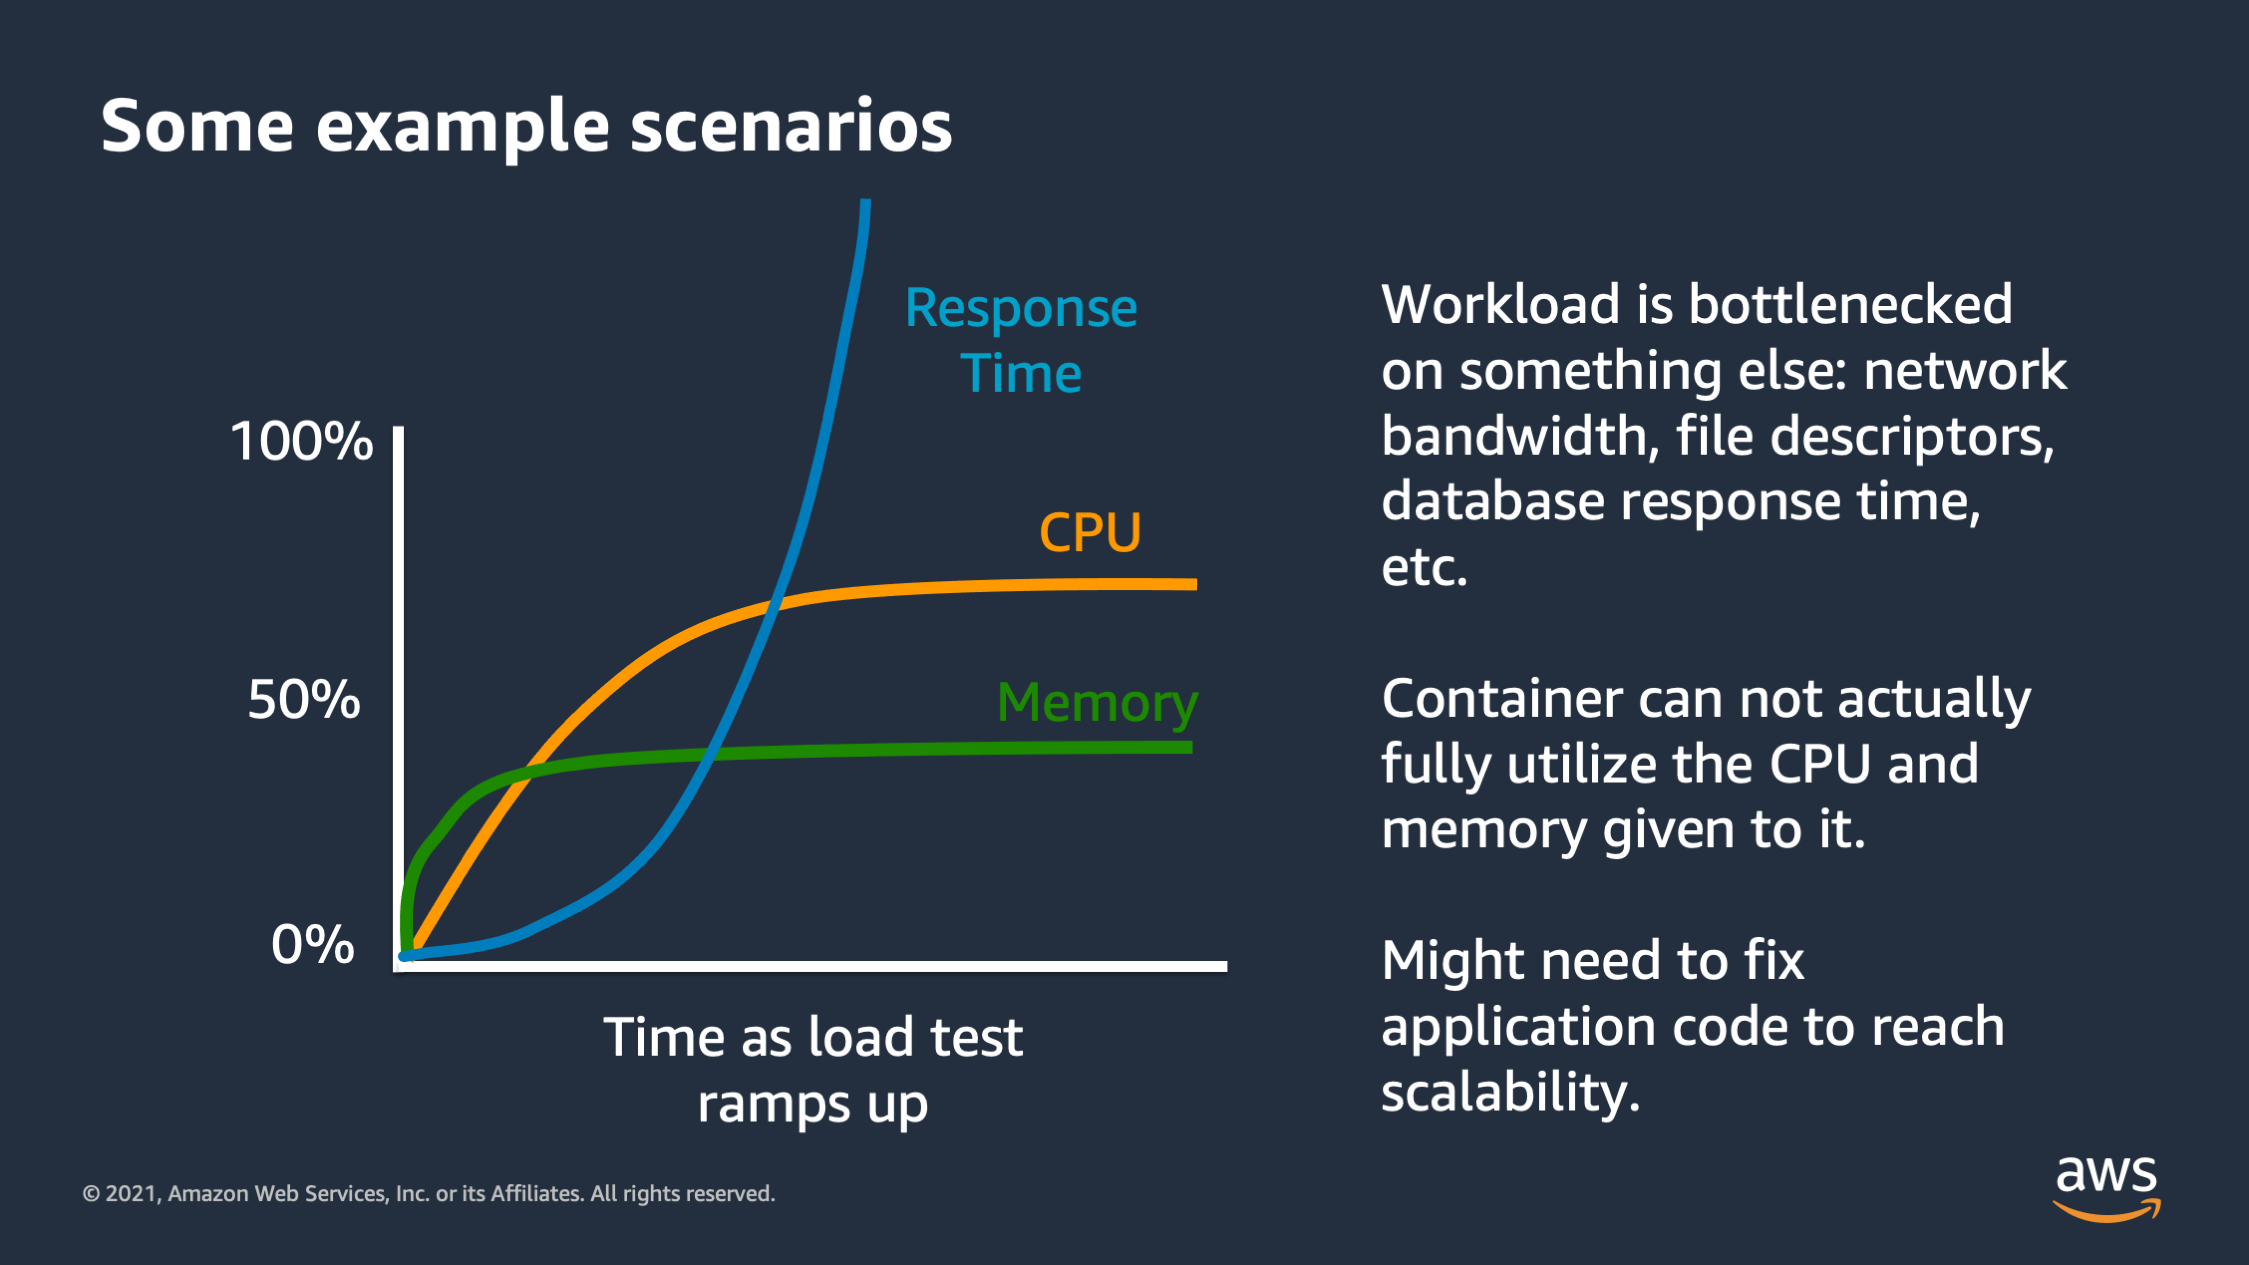
And then this is another type of graph that you might see. You might see the CPU and memory utilization actually flatten out below the max. So here I see CPU is flattening out at roughly 75%. Memory is flattening out below 50%, but the response time for the application is actually skyrocketing. It is going up and up and up.
So what’s going on here while there’s some type of bottleneck in the application and it’s not the CPU and it’s not the memory. There’s something that the application requires, maybe it’s network IO, maybe it’s disk IO, maybe it’s another downstream service that it is depending on like a database or another downstream API. And the response time is actually skyrocketing because of that other resource.
Most often this happens with a database. The database is overloaded because it’s handling too many queries. So if you see this, this is not an issue that you can actually fix with scaling. I can’t vertically or horizontally scale out of this scenario. I have to actually fix application code. So it might mean optimizing my database queries. It might mean optimizing the size of the downstream database I’d depend on, or maybe optimizing disk bandwidth or network IO in order to achieve scalability with my system. So keep your eyes out for this particular issue as well.
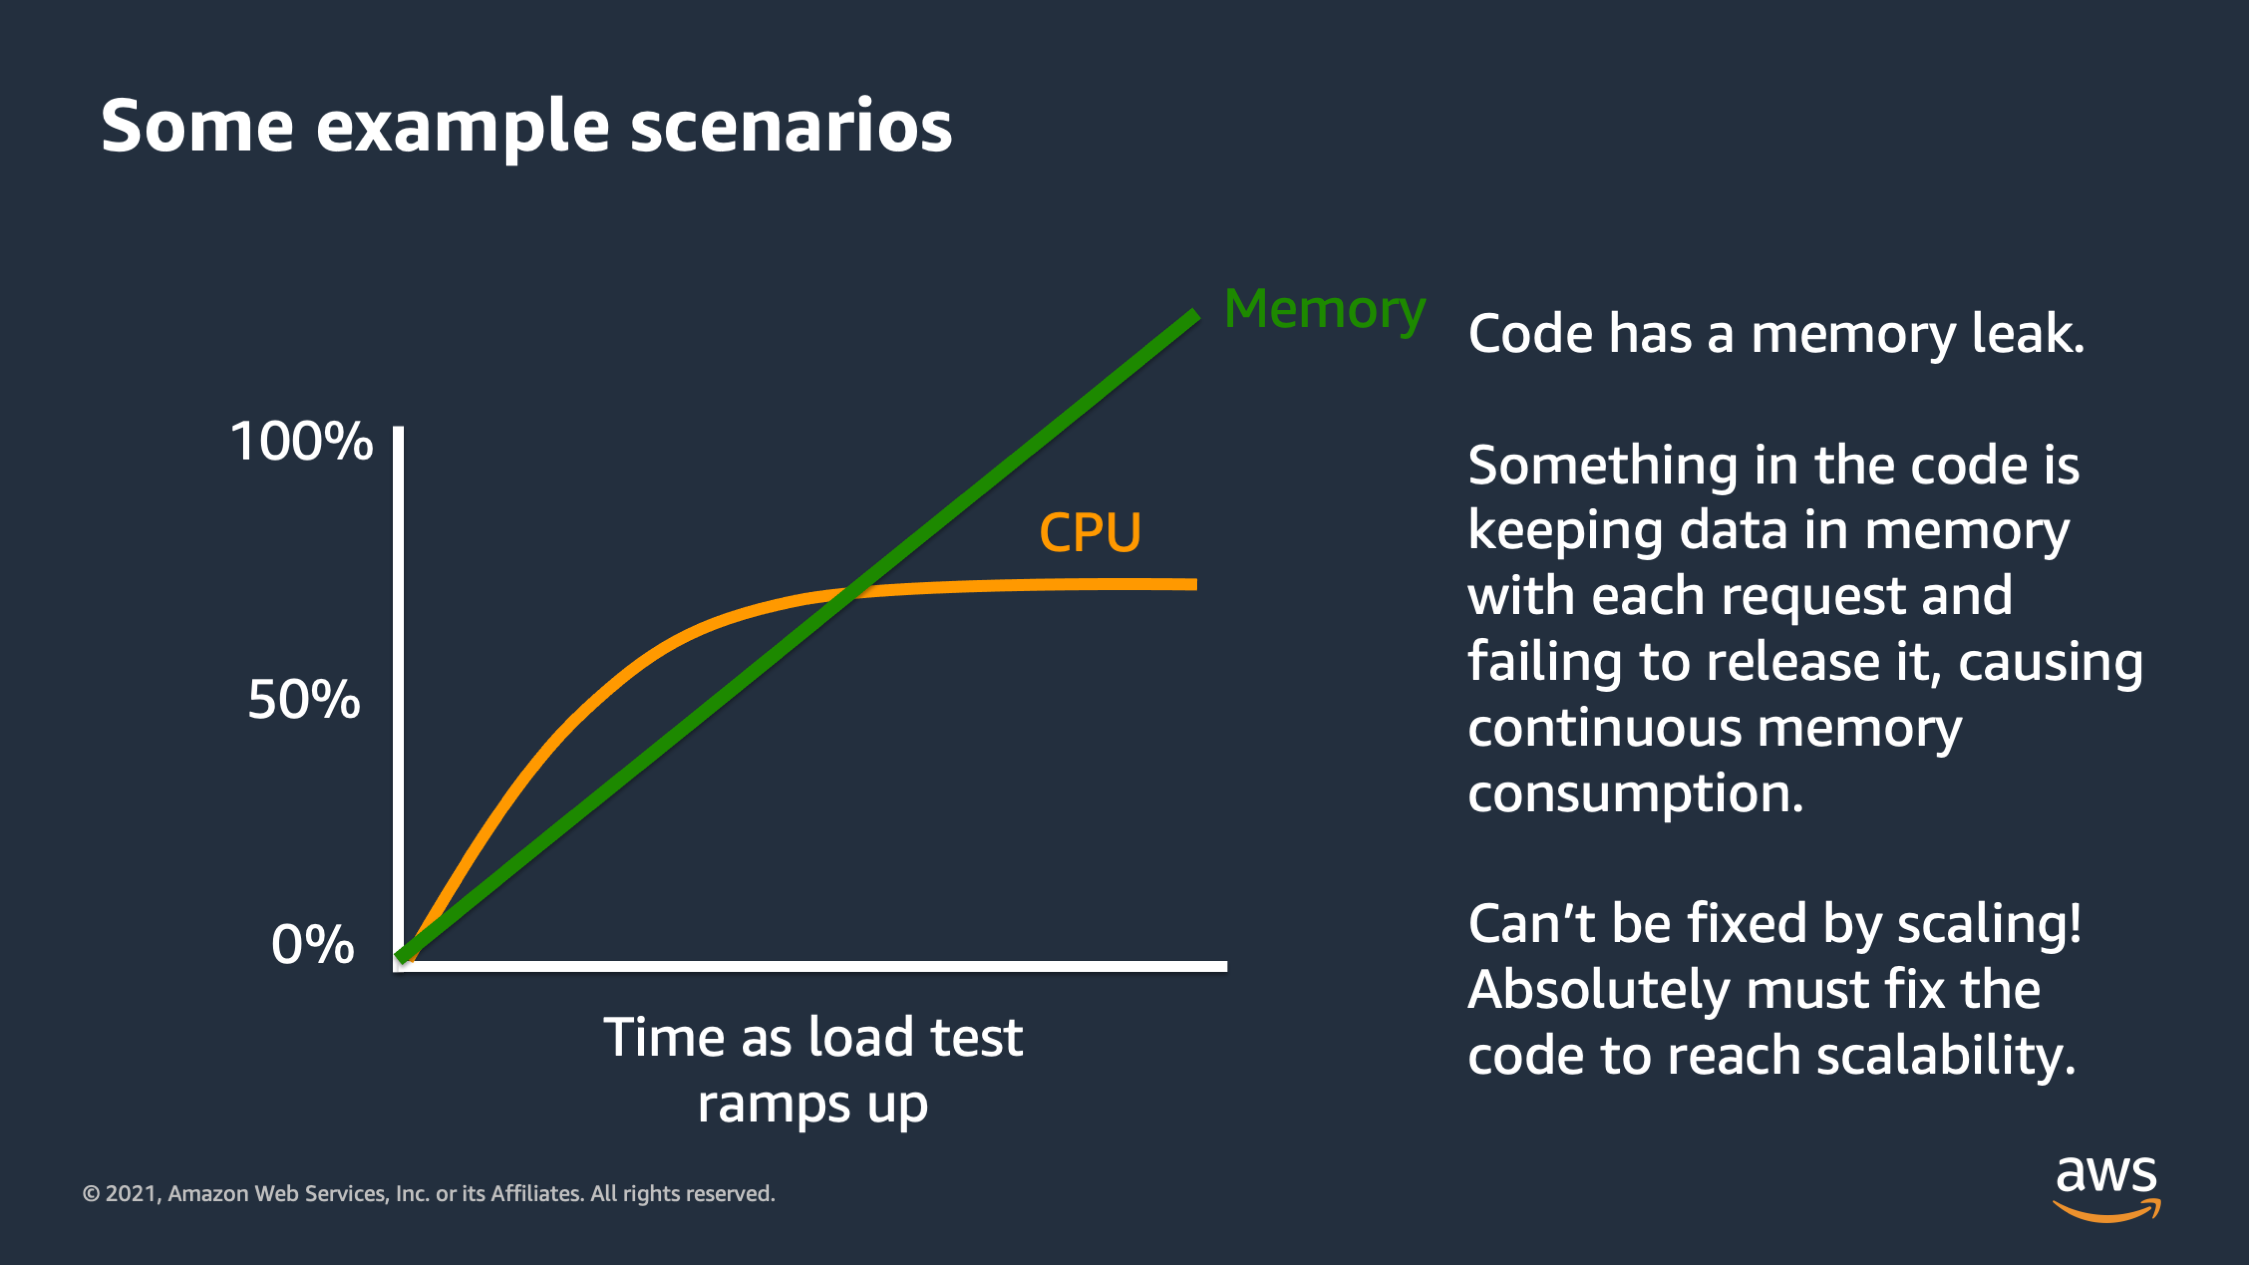
And then this one right here is a classic that I see many times. As the load test ramps up, we see the CPU flattens out at roughly 75%, but memory keeps on rising and it rises in almost straight line. So something is going on here. It’s really bad. That’s called a memory leak. And so in this scenario every time the application is serving a request, it’s actually keeping some data in memory and it’s not getting rid of that data. It’s just accumulating and accumulating and accumulating. This type of issue, it can cannot be fixed by scaling. You can’t vertically or horizontally scale yourself out of a memory leak issue. What’s going to happen is memory will keep on rising until it reaches a point where it consumes all of the memory. The application will crash at that point. The only way to fix this is to fix the application code. You cannot have scalability with this type of scenario. So keep your eye out for that, because this is something where you need to go back to application developers and say, we need to fix this and we need to fix this fast.
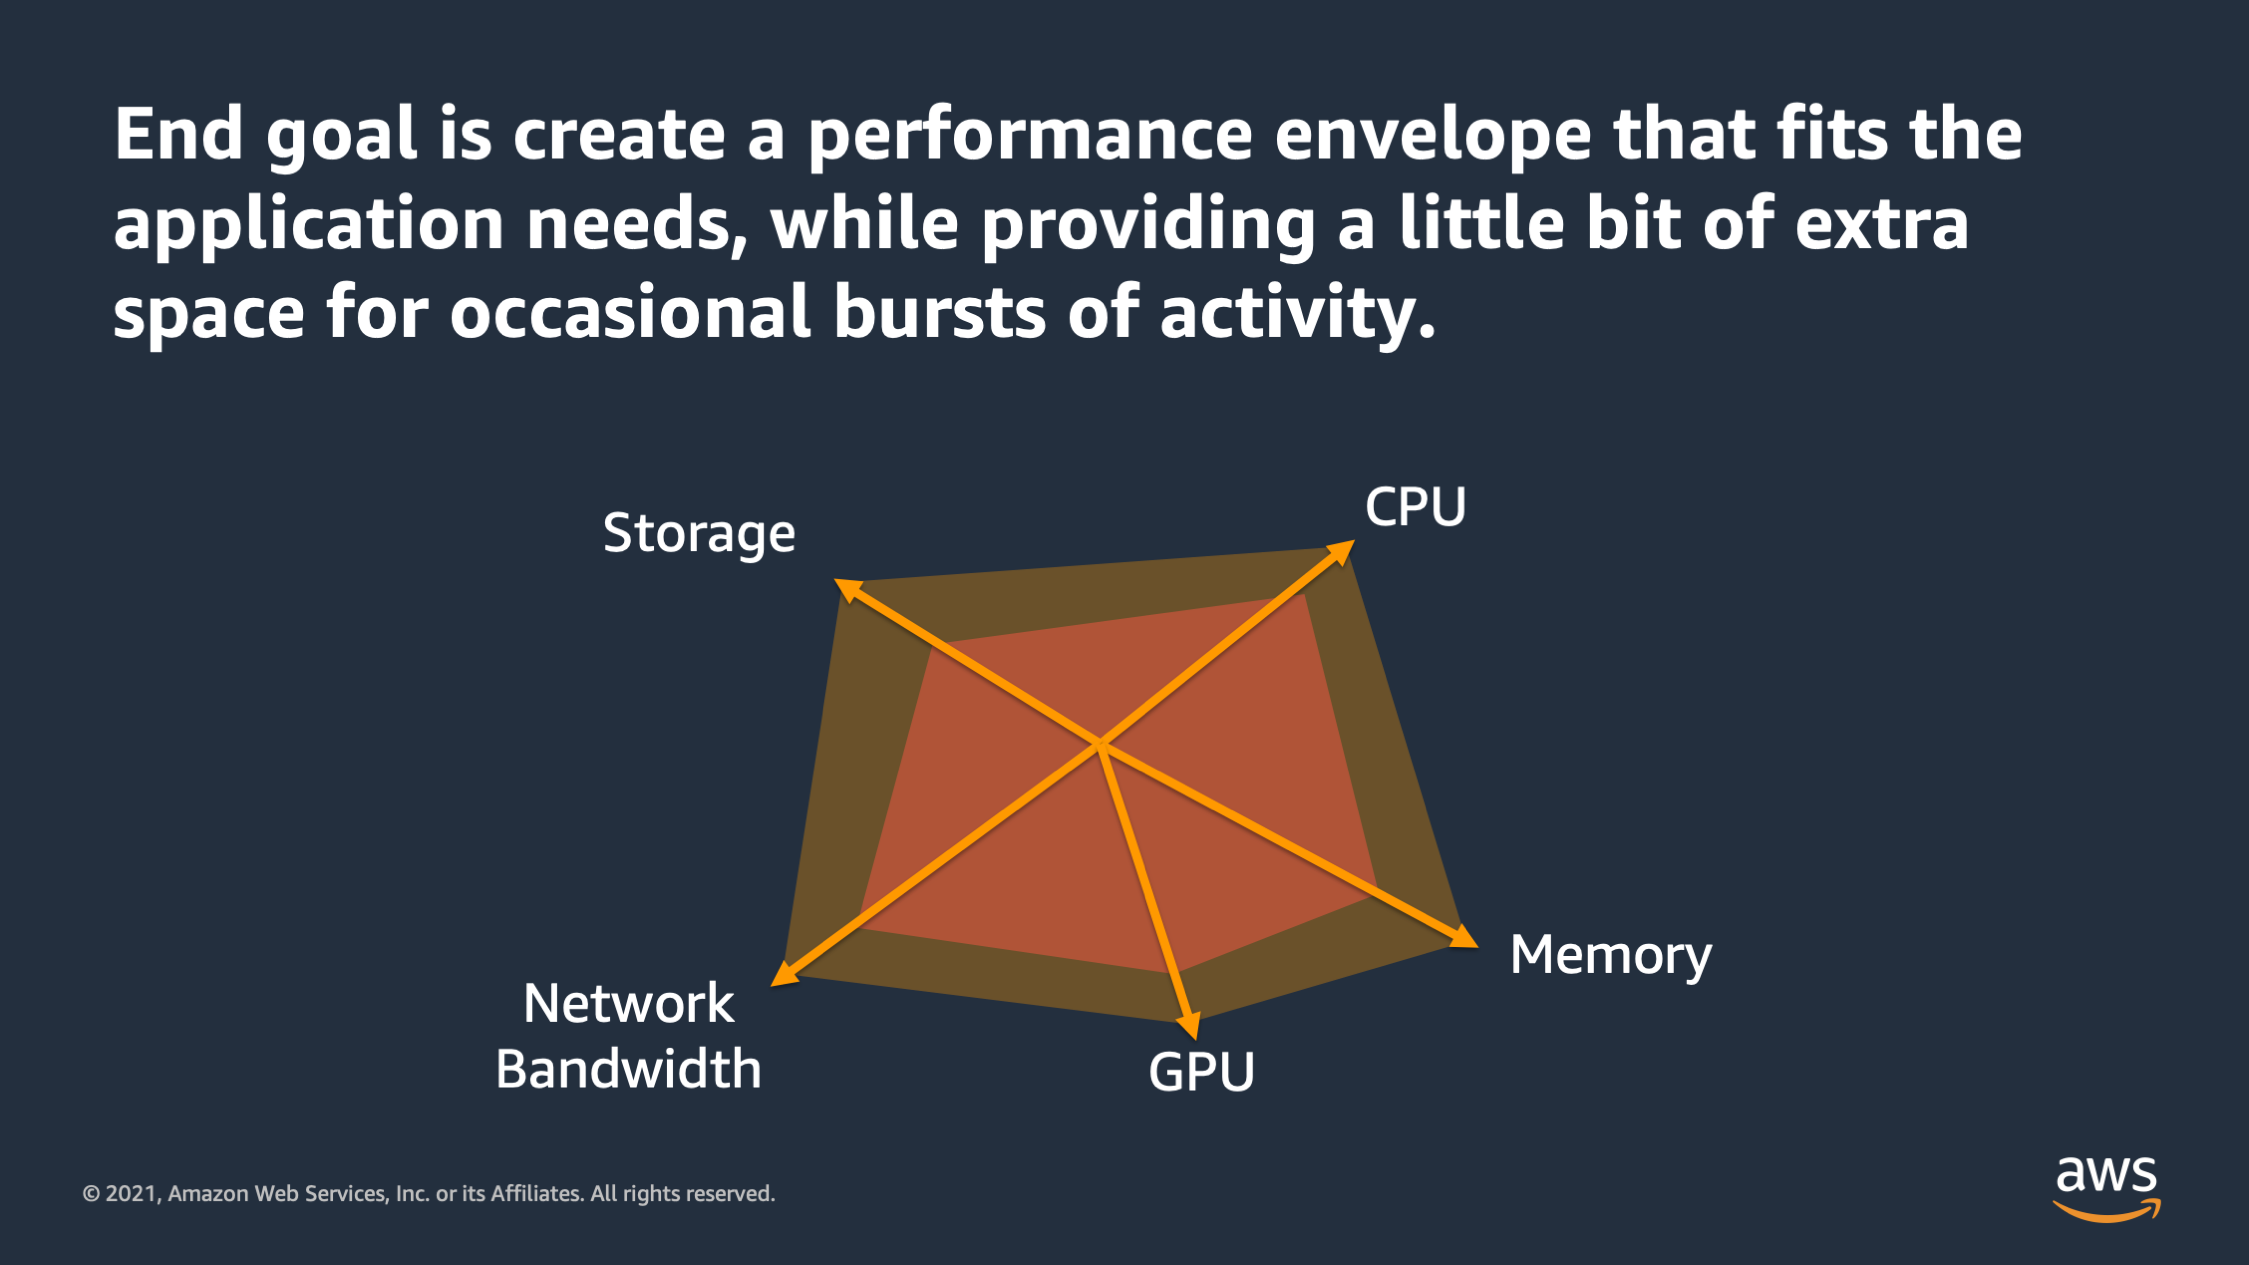
So the end goal of all this low testing and metric analysis is to create a performance envelope that fits your application needs. And ideally also provides a little bit of extra space for occasional bursts of activity. Maybe, you know, that occasionally there’ll be a burst of traffic or the application will need to work on one particular transaction that is heavier than the others. Like let’s say a user logging in and it needs to hash a password.
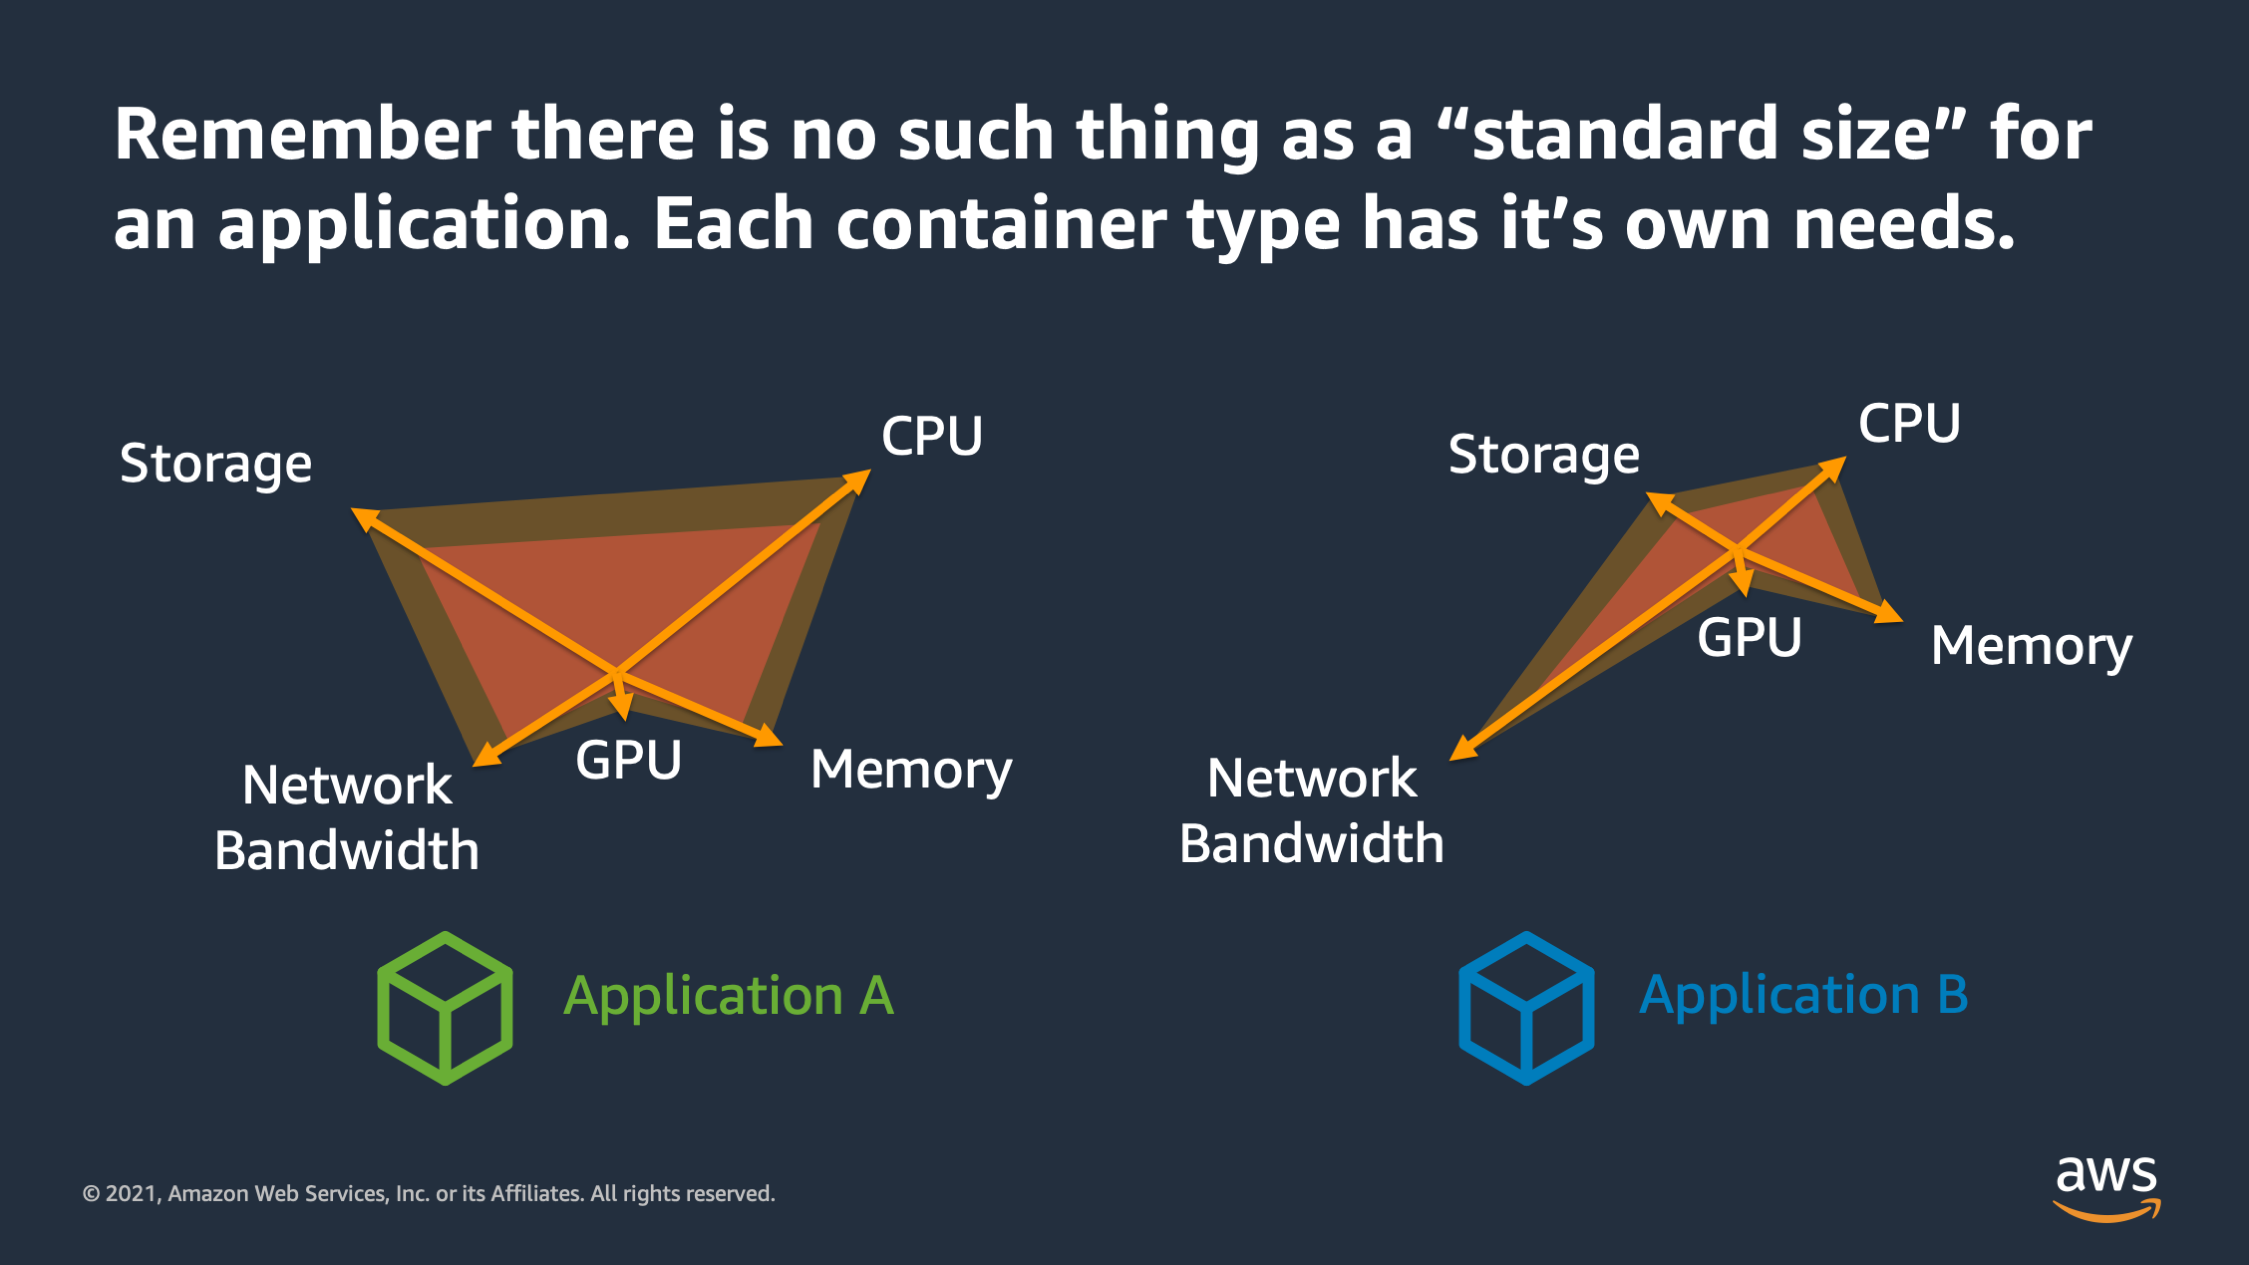
There’s a couple of things to keep in mind as you’re defining the performance envelope. The first is that there is no such thing as a standard size for an application. A lot of times people come to me and say: “Nathan, you know, how big should my application be? You know is 1024 CPU enough? Is two gigabytes of memory enough?” And what I tell them is: “Don’t think about it as you know, standard sizes, because there is no such thing as a standard size for an application.”
Each application that you run has its own needs and its own performance envelope. Some may require more CPU, some require more memory. Some of may require more network bandwidth, but you need to find a unique performance envelope for each application. Don’t try to stuff every app every container into the same performance envelope.
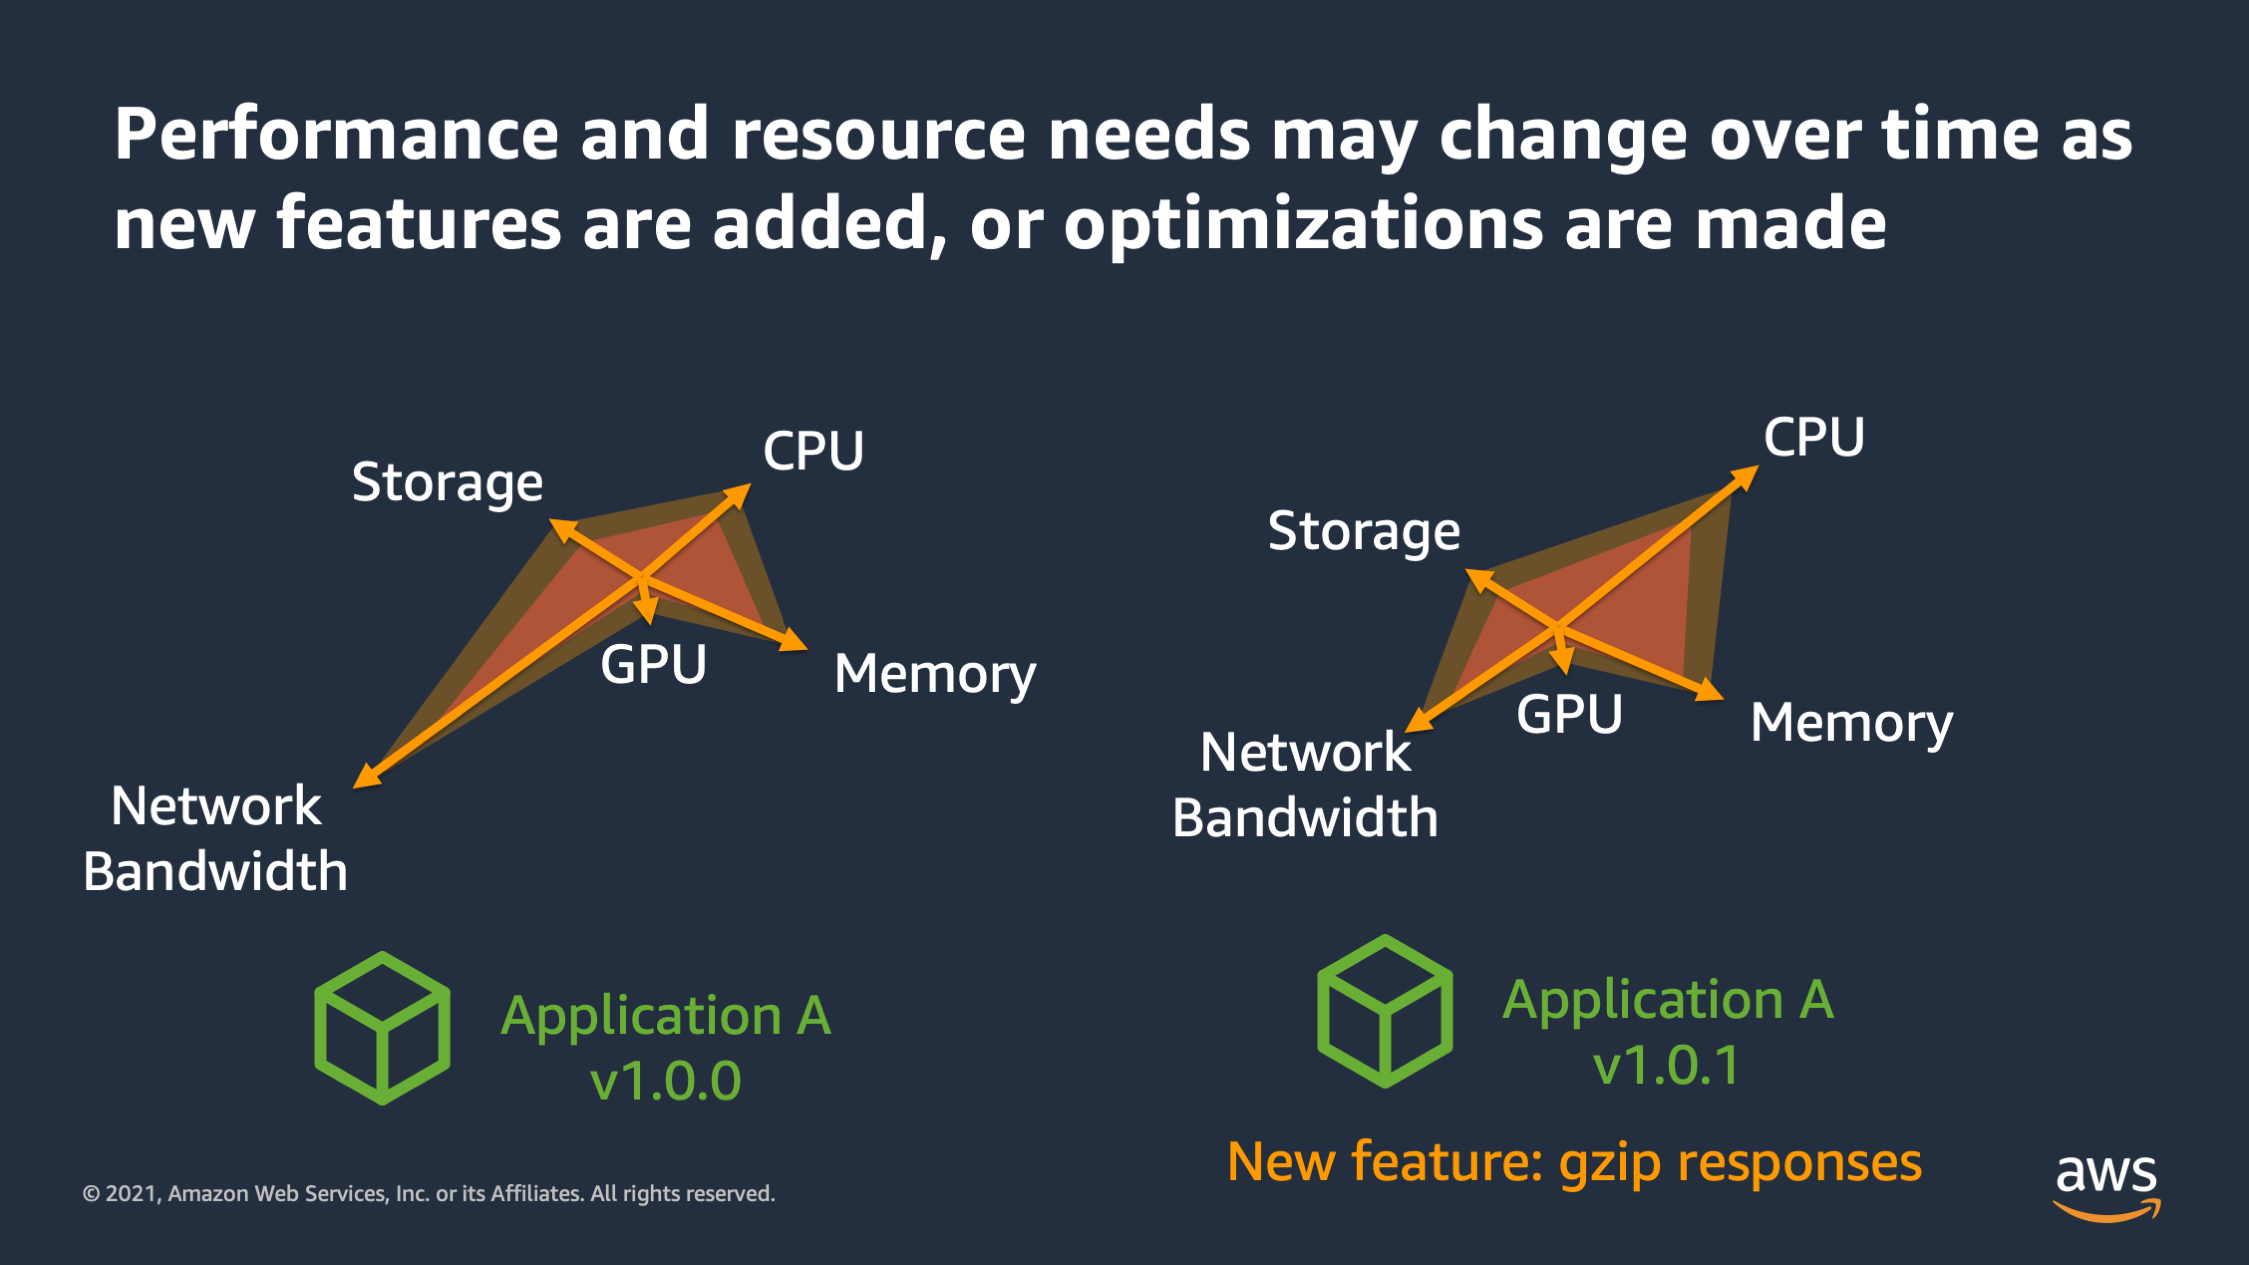
And the other thing is these performance audits can change over time. So as you add features or modify how features work to optimize things, the performance envelope may change. So here we see application A, version one has high network bandwidth needs, but then in 1.01 version, the network bandwidth actually was reduced because we had this new feature to Gzip the responses. So we’re compressing the responses as they go out of the server. And that reduced the amount of network bandwidth that was needed before, but it increased the amount of CPU. So a lot of times as performance envelopes change, you’ll need to adjust the different resources that are available.
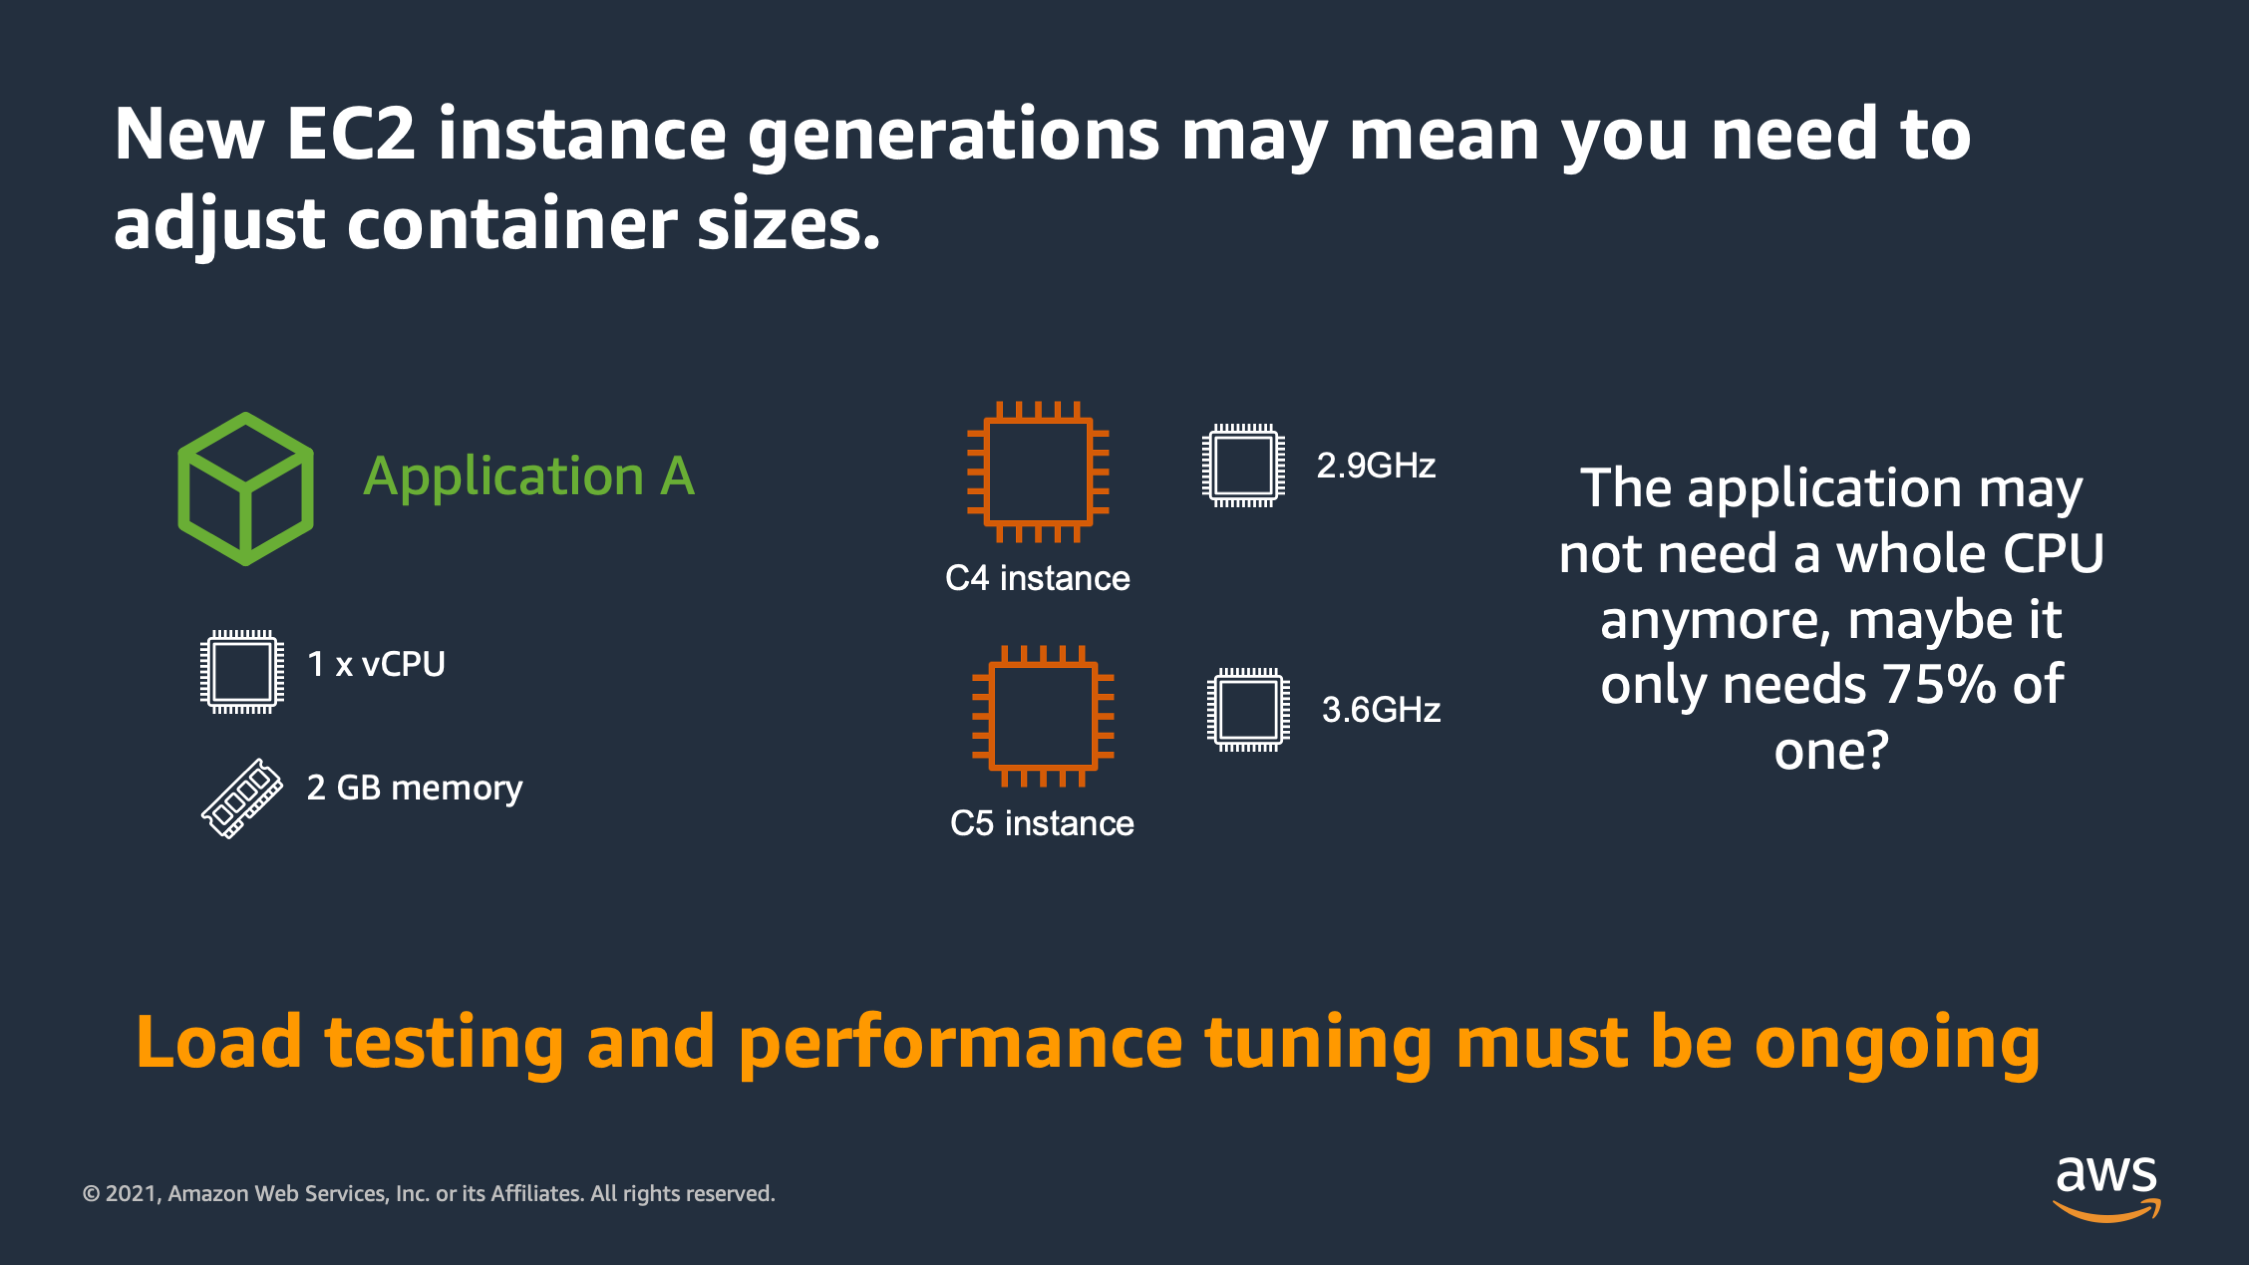
Additionally as you migrate to new EC2 instance generations you may also need to adjust your performance envelope. And let me explain why if you look at the C4 instance class compared to the C5 instance class EC2 instances, the C4 instance actually has a 2.9 gigahertz processor while the C5 has 3.6 gigahertz sustained processor speed.
So in that scenario, an application, as you migrate it from C4 to C5, may not actually require one whole CPU anymore because the new CPU is actually much faster. Maybe the application now only needs 75% of the CPU. So the key things to remember between the performance envelope of the application, changing with feature releases and new EC2 generation, is that low testing, it has to be ongoing.
You can’t do it as a one-time thing and then say: “this will be static forever.” You have to consistently be load testing and adjusting tuning the vertical scaling.
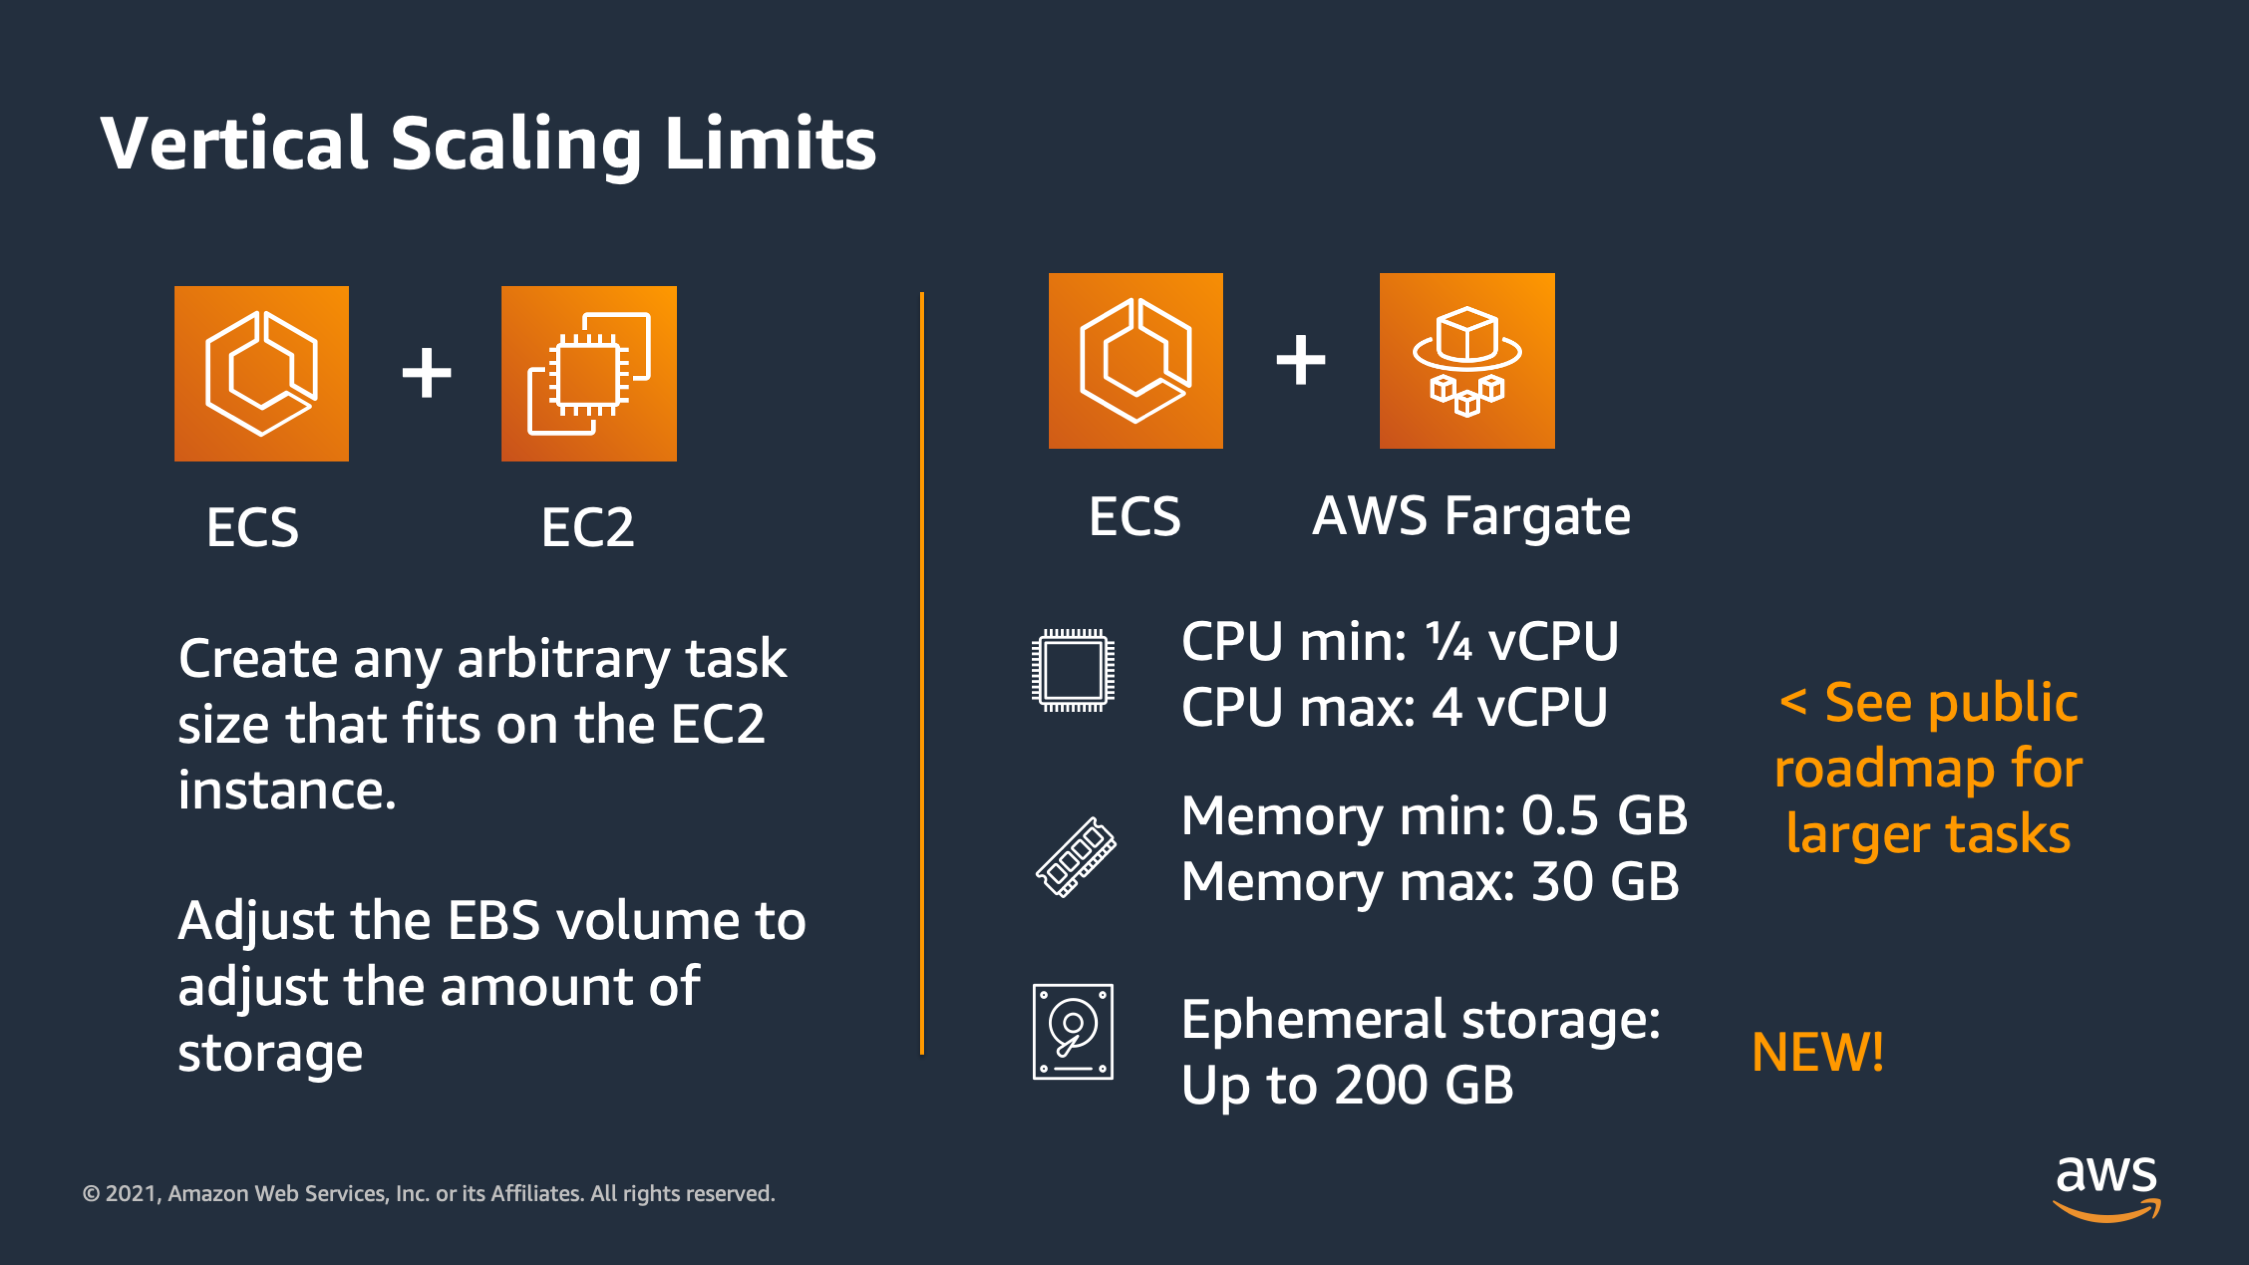
I want to talk a little bit about vertical scaling limits before I move on. And the vertical scaling limits is going to define how far you can vertically scale. So with ECS plus EC2 it’s fairly flexible because you can create any arbitrary task size that will fit on onto the EC2 instance. And when it comes to storage, you can adjust the EBS volume attached to the C2 instance in order to adjust the scaling of the storage. For ECS plus AWS Fargate there is a different limit. So for CPU, the lowest you can go as one quarter of a CPU and the highest you can go as four CPU’s and half a gigabyte of memory or up to 30 gigabytes of memory.
And then ephemoral storage can be up to 200 gigabytes. So keep in mind these vertical scaling limits as you consider the platform that you want to use for compute.
But at this point, let’s talk and more about horizontal scaling now. So with horizontal scaling, the goal is to have more application containers to spread the work across. So we’ve already found a good performance envelope for vertical scaling, but now we want to spread more of that work across more containers.
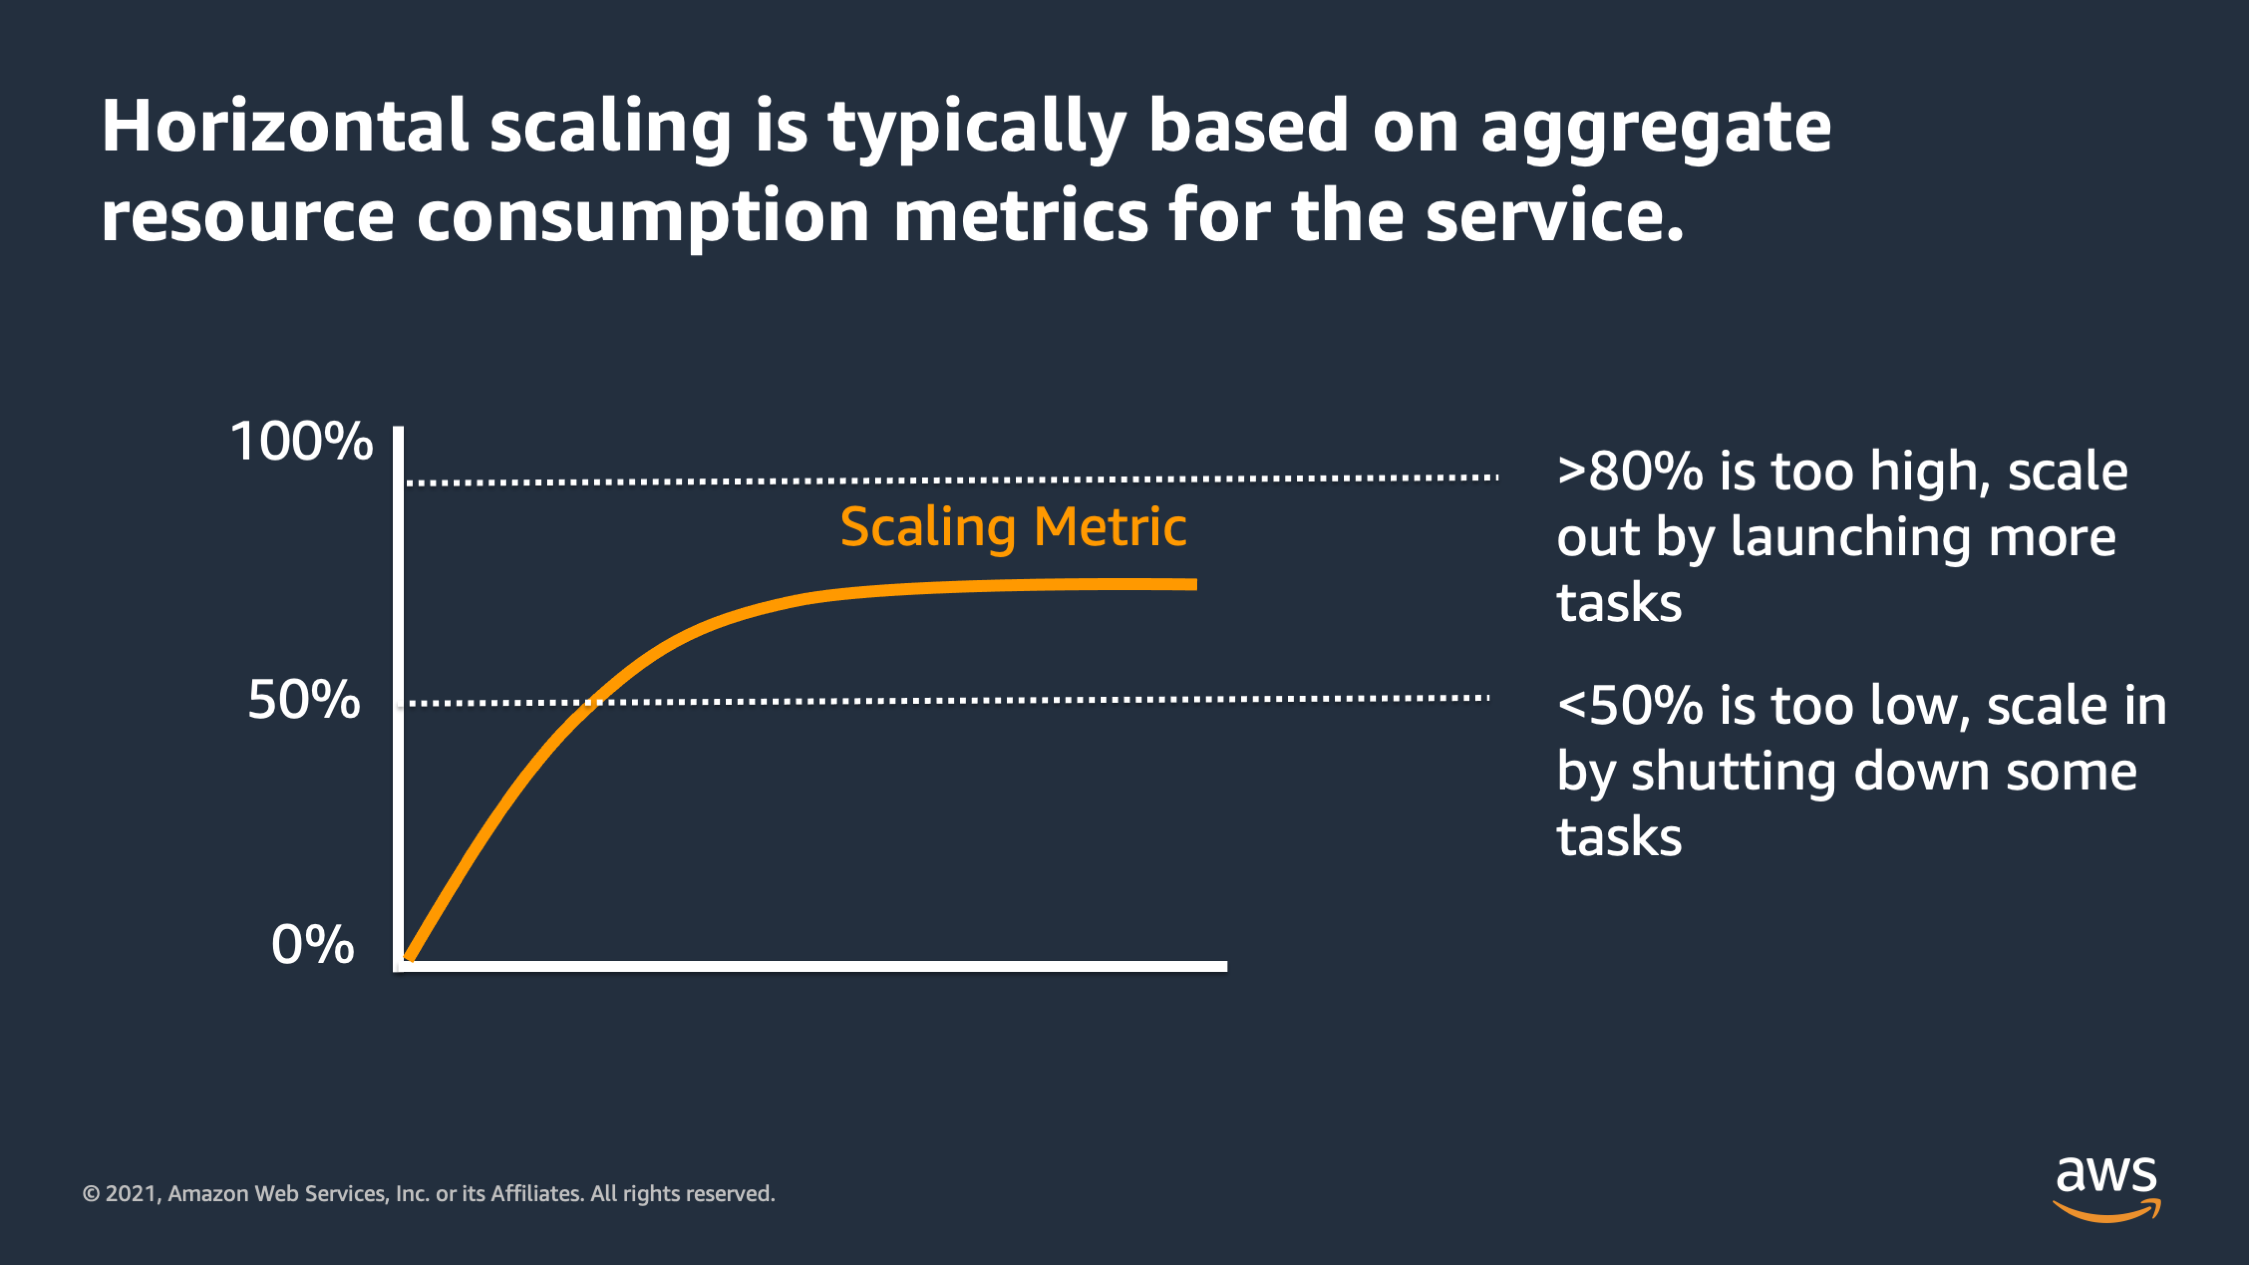
So in general, horizontal scaling should always be based on aggregate resource consumption metrics for the service. And as the resource consumption metric reaches a certain threshold, we say: “The resource consumption is too high. So I want to scale out by adding more tasks.” Or if the scaling metric is too low, we say: “It’s too low. I want to scale in by shutting down some tasks.”
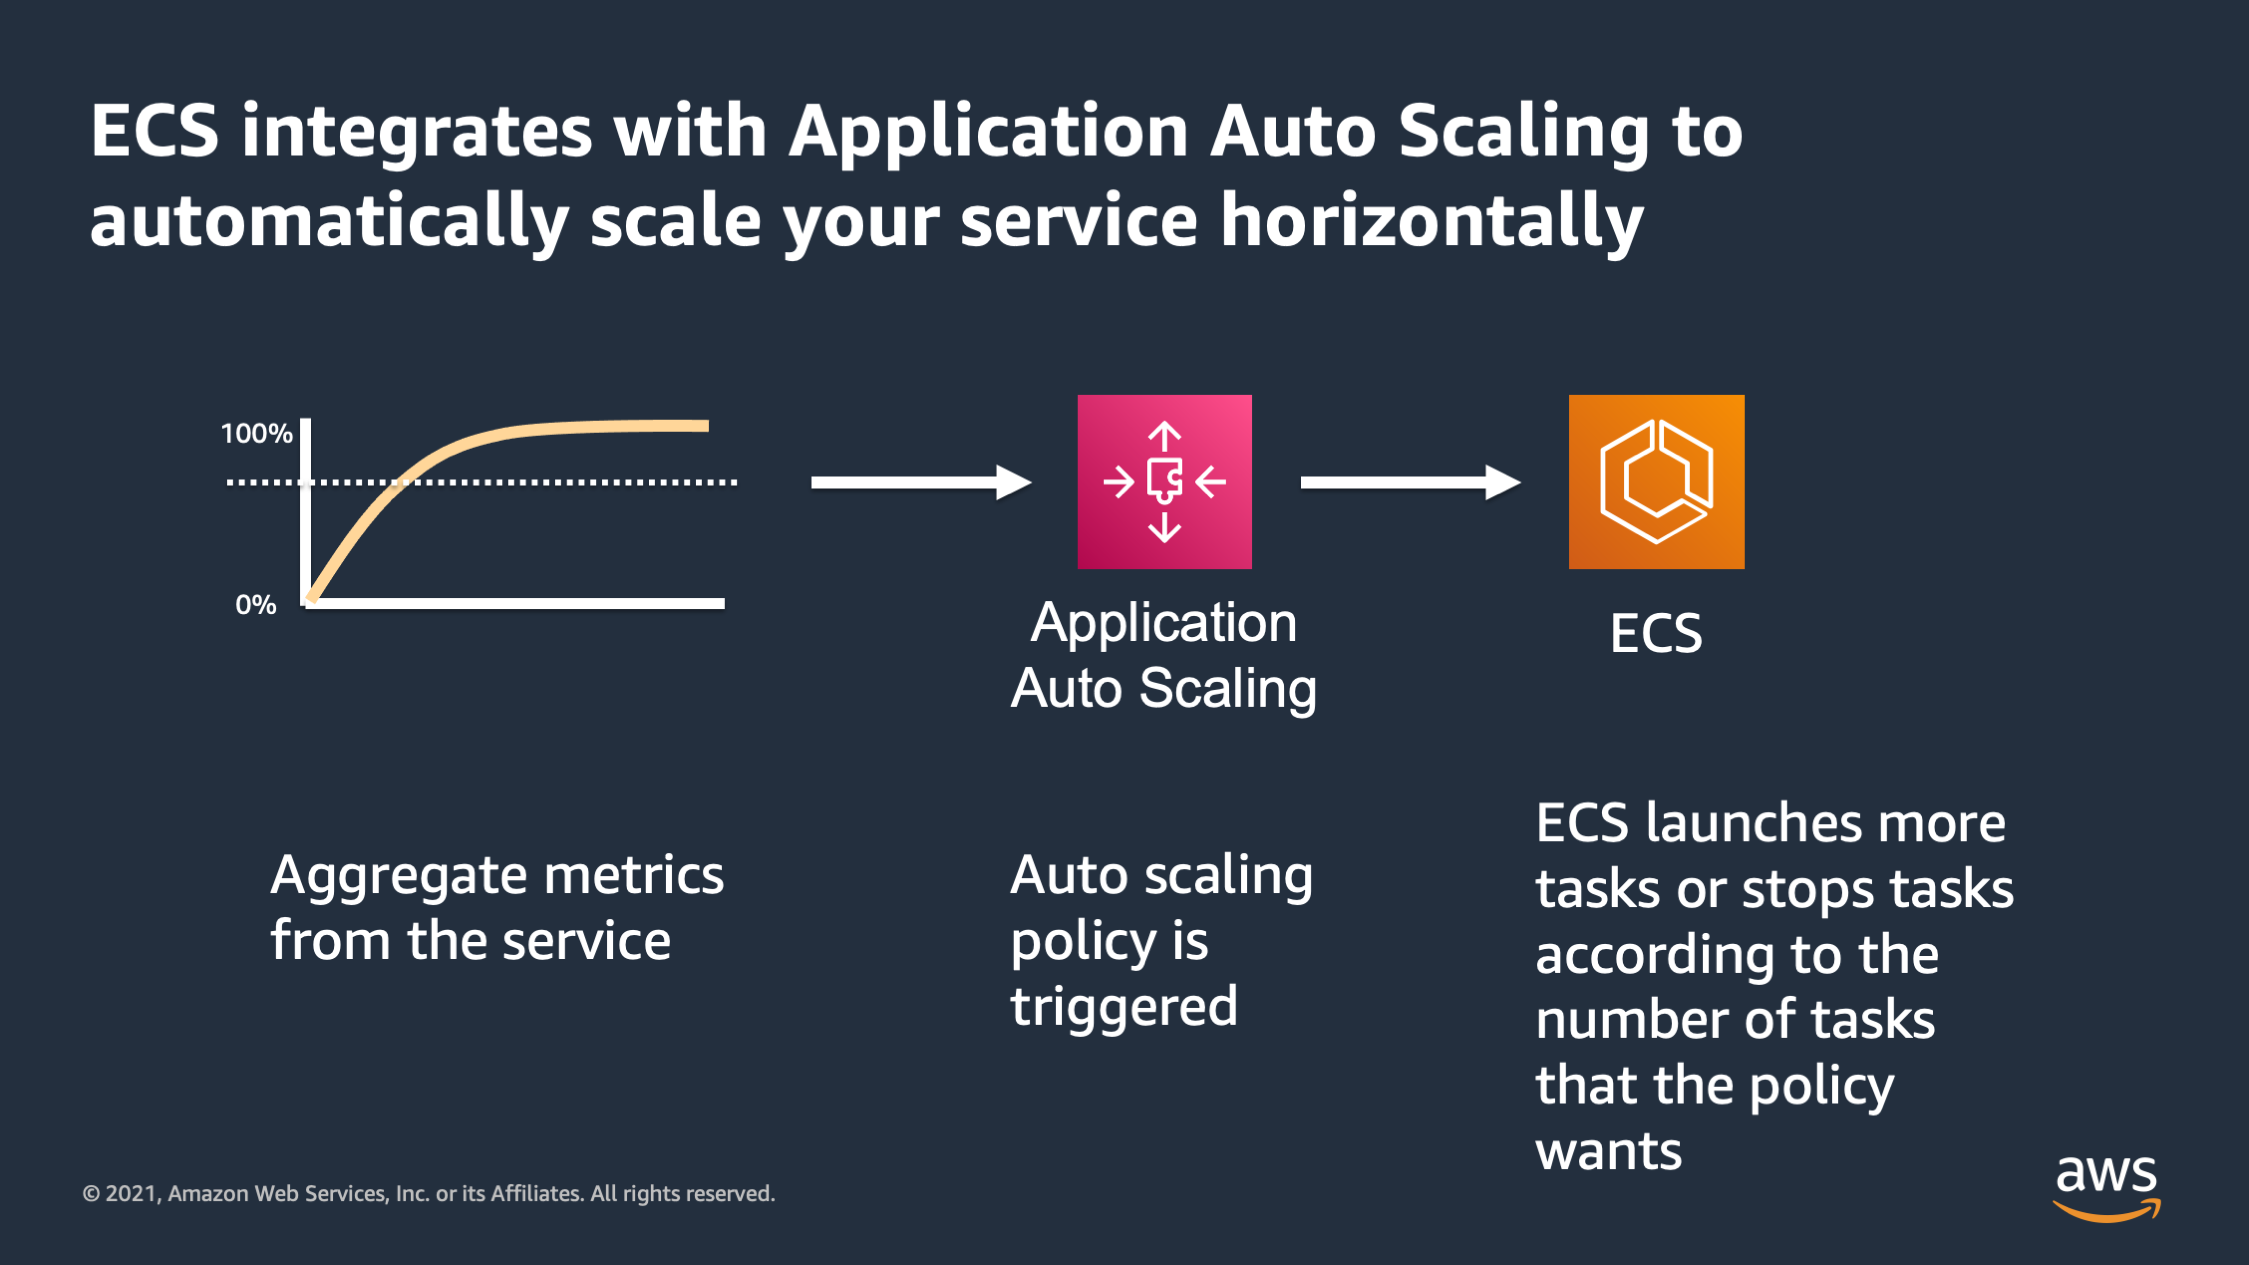
So ECS integrates with application auto scaling to automatically scale your service. It takes the aggregate metrics for the service. The aggregate metrics trigger an application auto scaling policy, and then ECS responds to that policy by adding or removing tasks according to what the policy asked for.
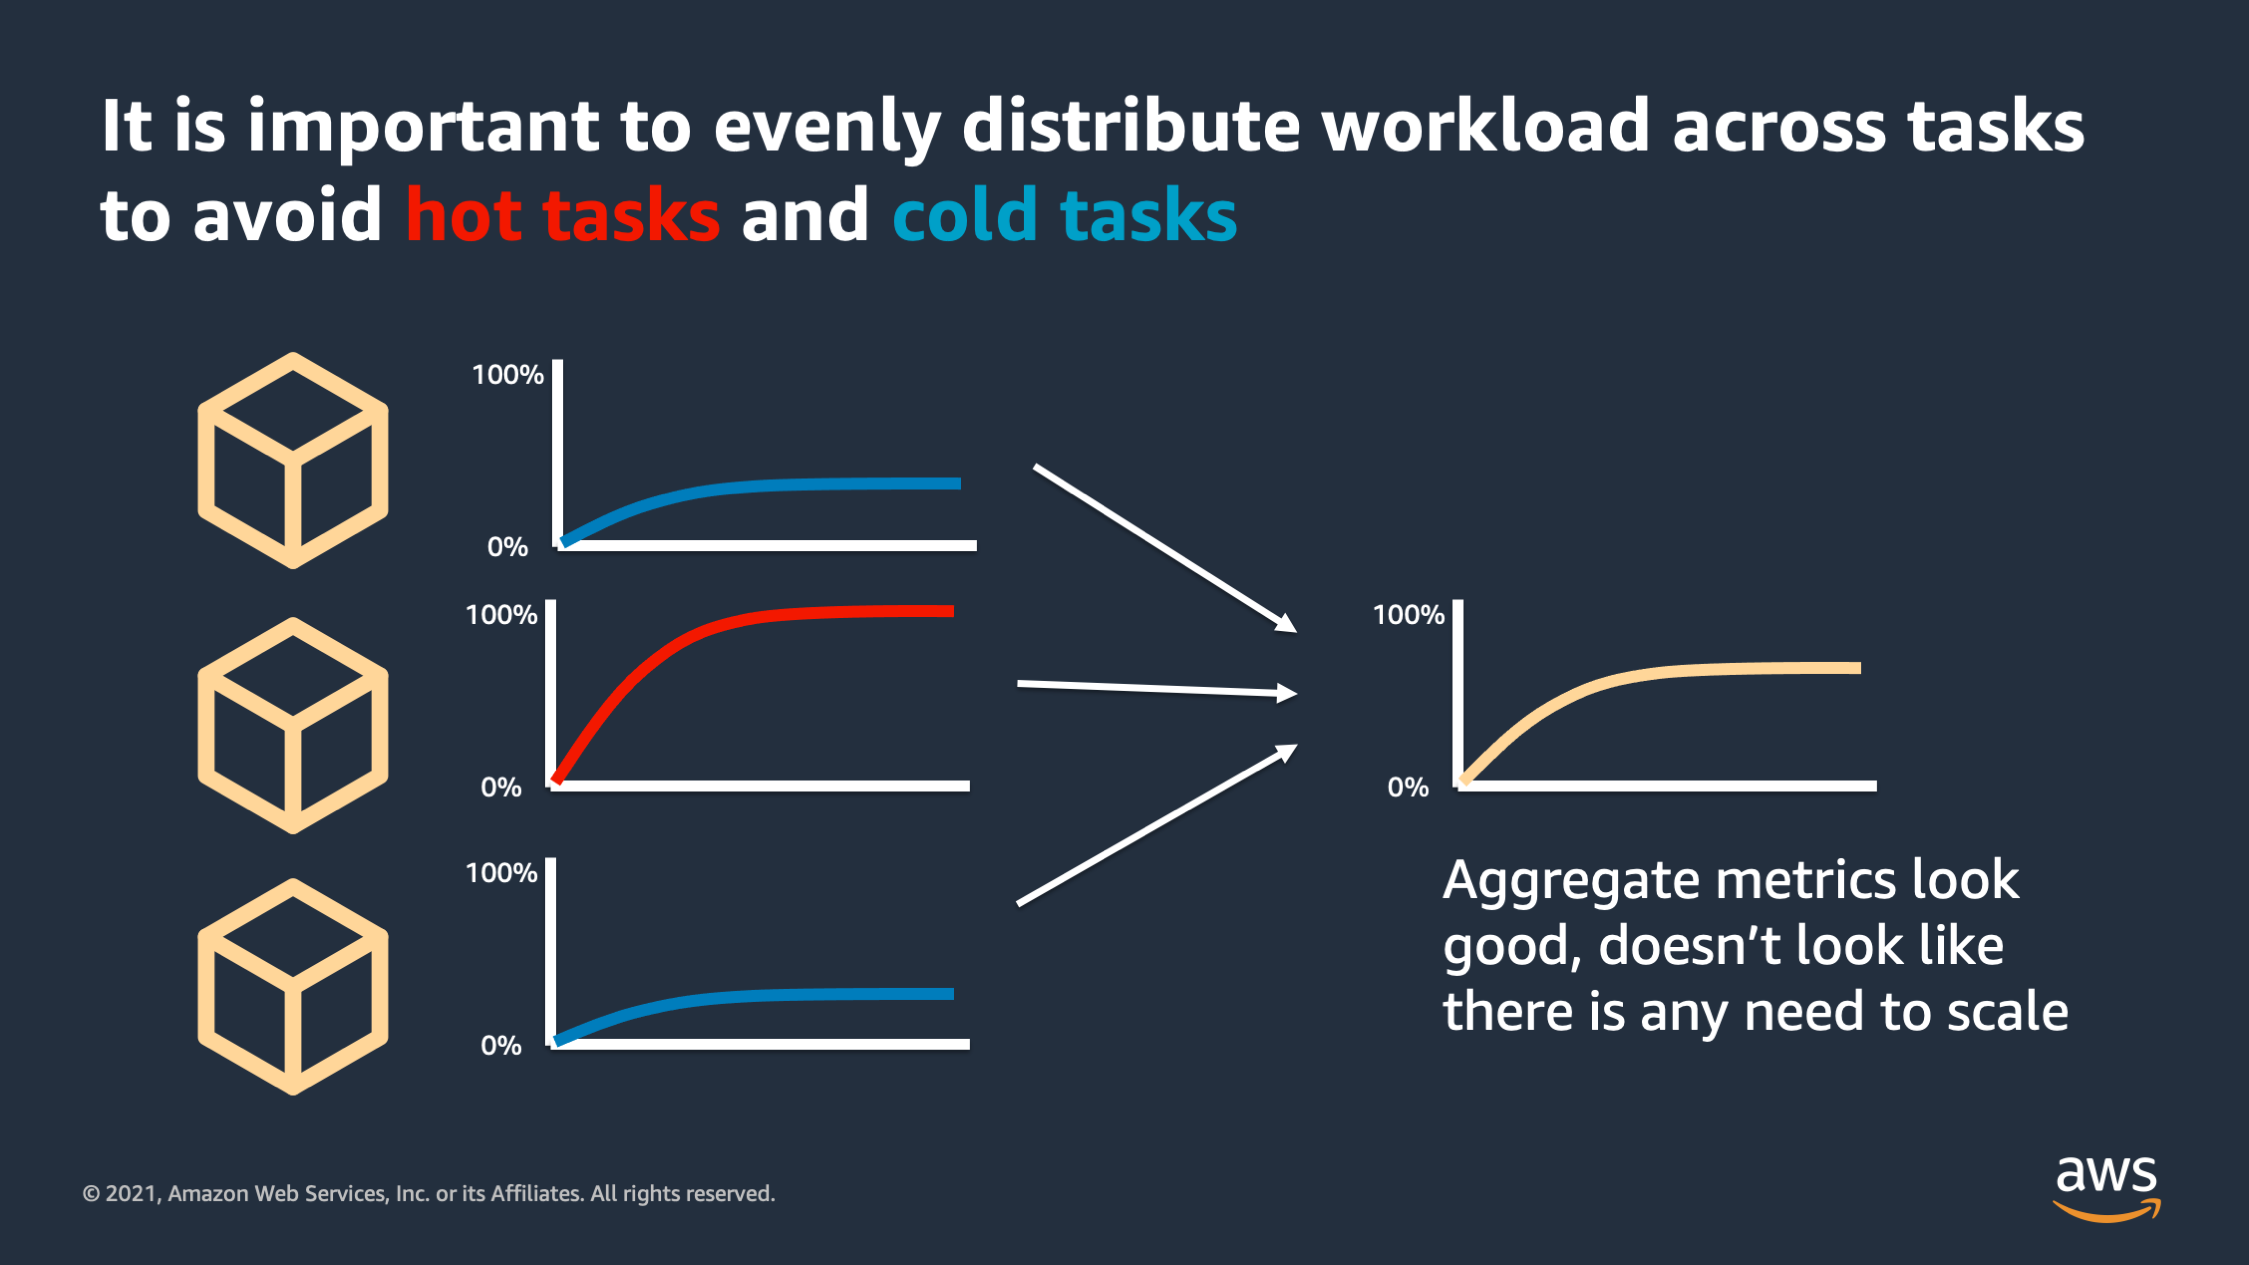
One pitfall I want to highlight that is very important is to evenly distribute the workload across our tasks to avoid hot tasks and cold tasks. I most often see this happen with WebSocket requests or other applications that have really long lived connections that serve a lot of work over a long live collection connection. What can end up happening is you have one client or one connection that is doing a lot of volume over the connection versus other connections are much lower traffic. And what that ends up with is you end up with hot tasks that are, that are hitting the resource limits while other tasks are under utilized, they’re cold.
And the danger there is you can end up with aggregate metrics that still look good. It looks like the metric, the resources, are within bounds and it doesn’t look like there’s any need to scale, but the reality is behind the scenes some of your tasks are extremely hot and they’re suffering.
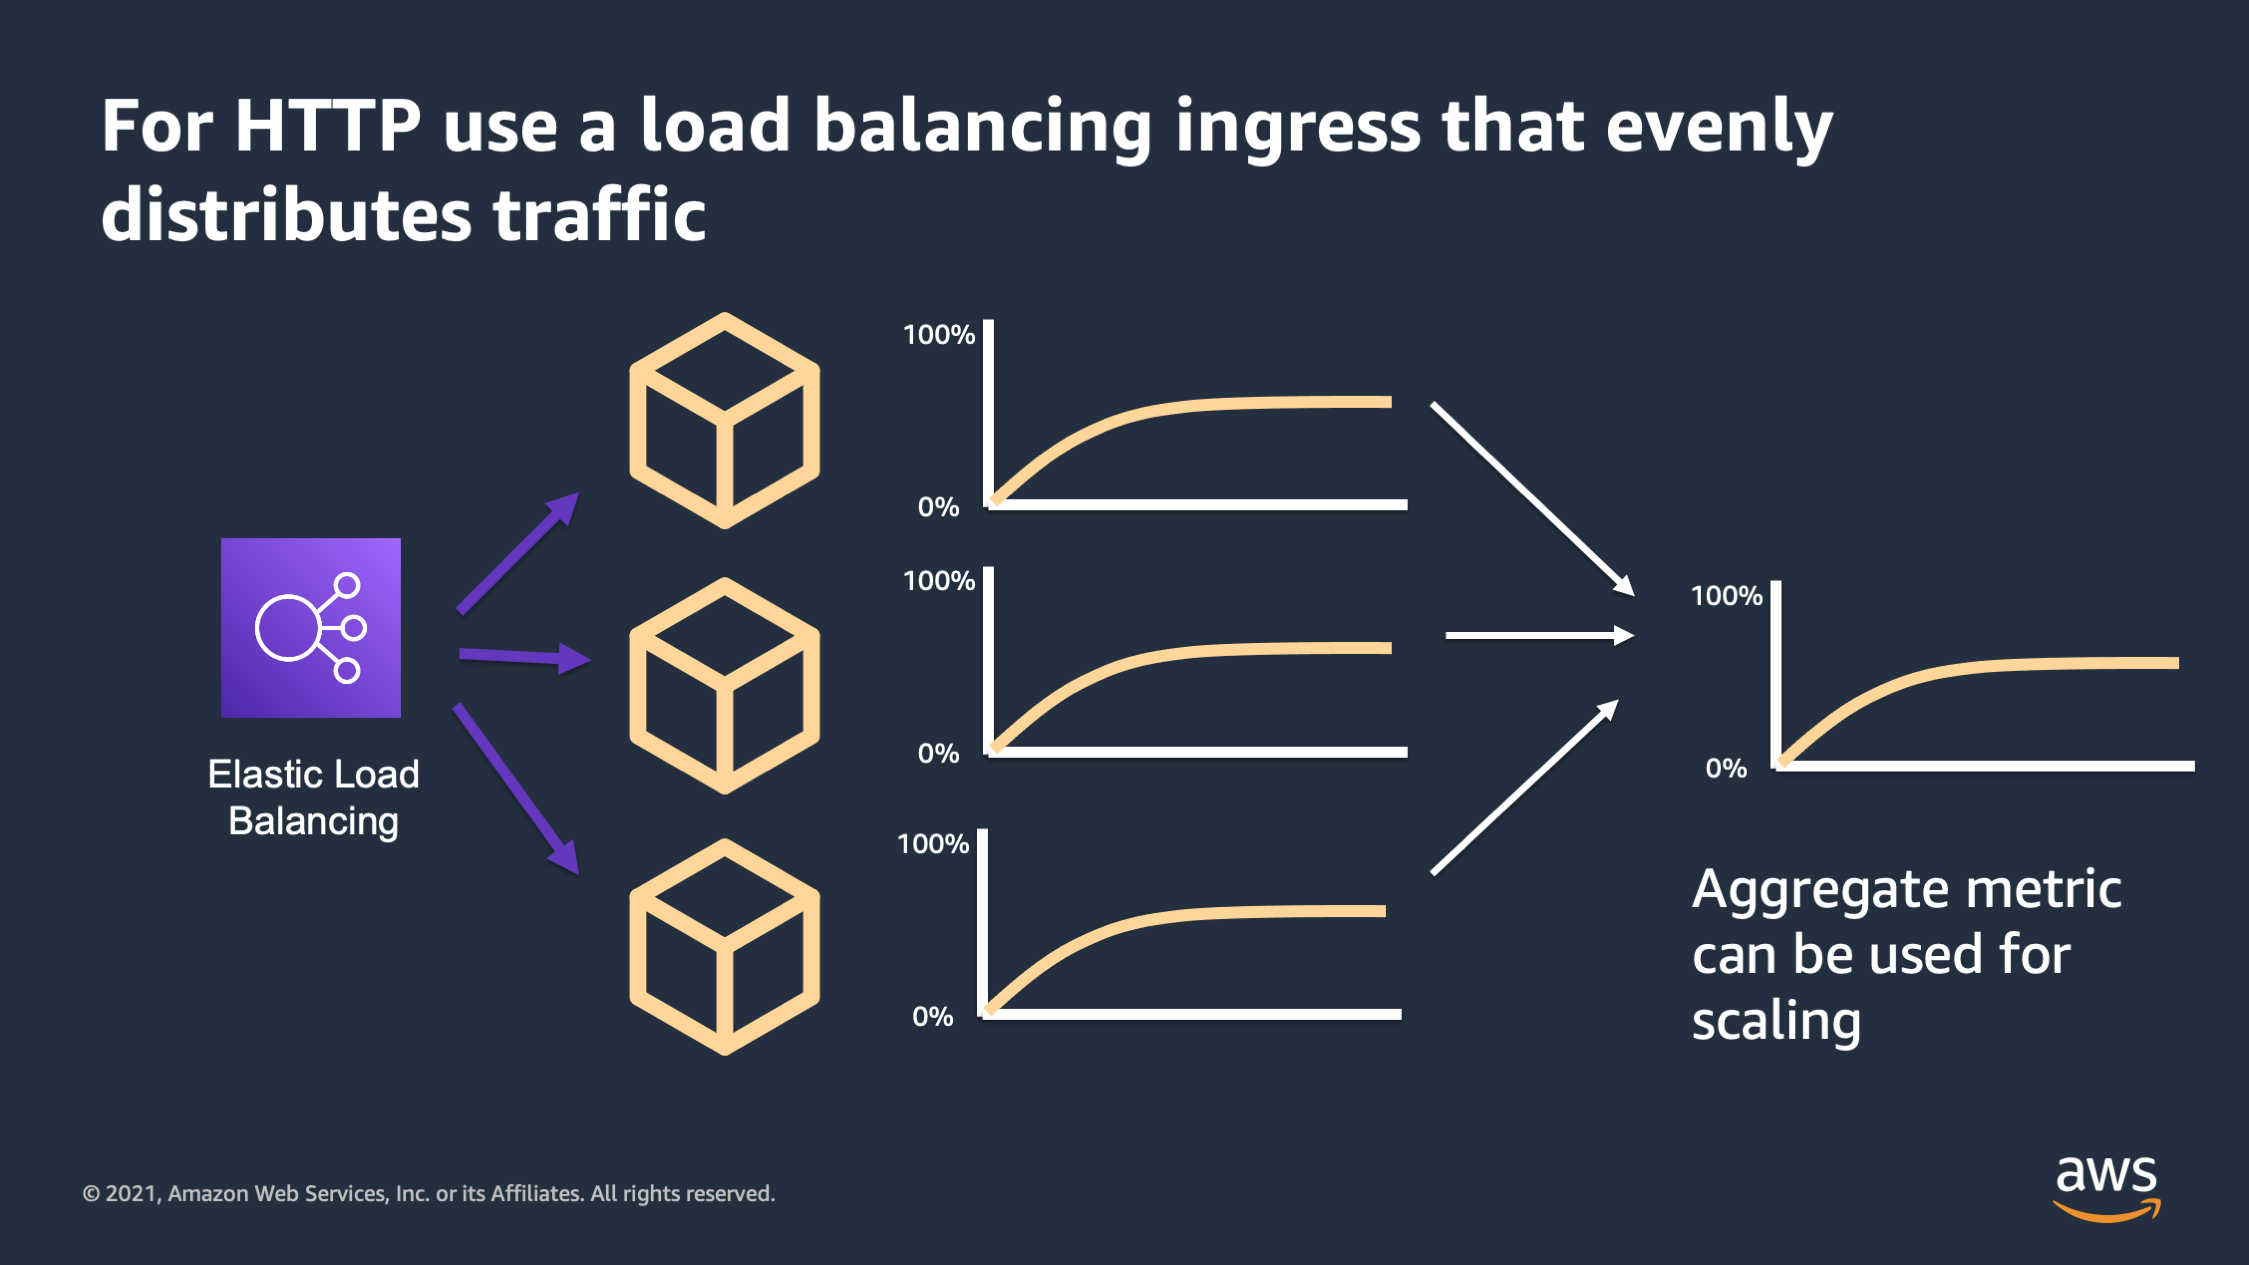
So for HTTP workloads in specific, make sure you have a load balancing ingress that will evenly distribute the traffic across the containers that are available. When this is working properly, what you’ll see is all of the containers will actually be roughly in sync with their resource utilization rather than having some that are hot and some that are cold.
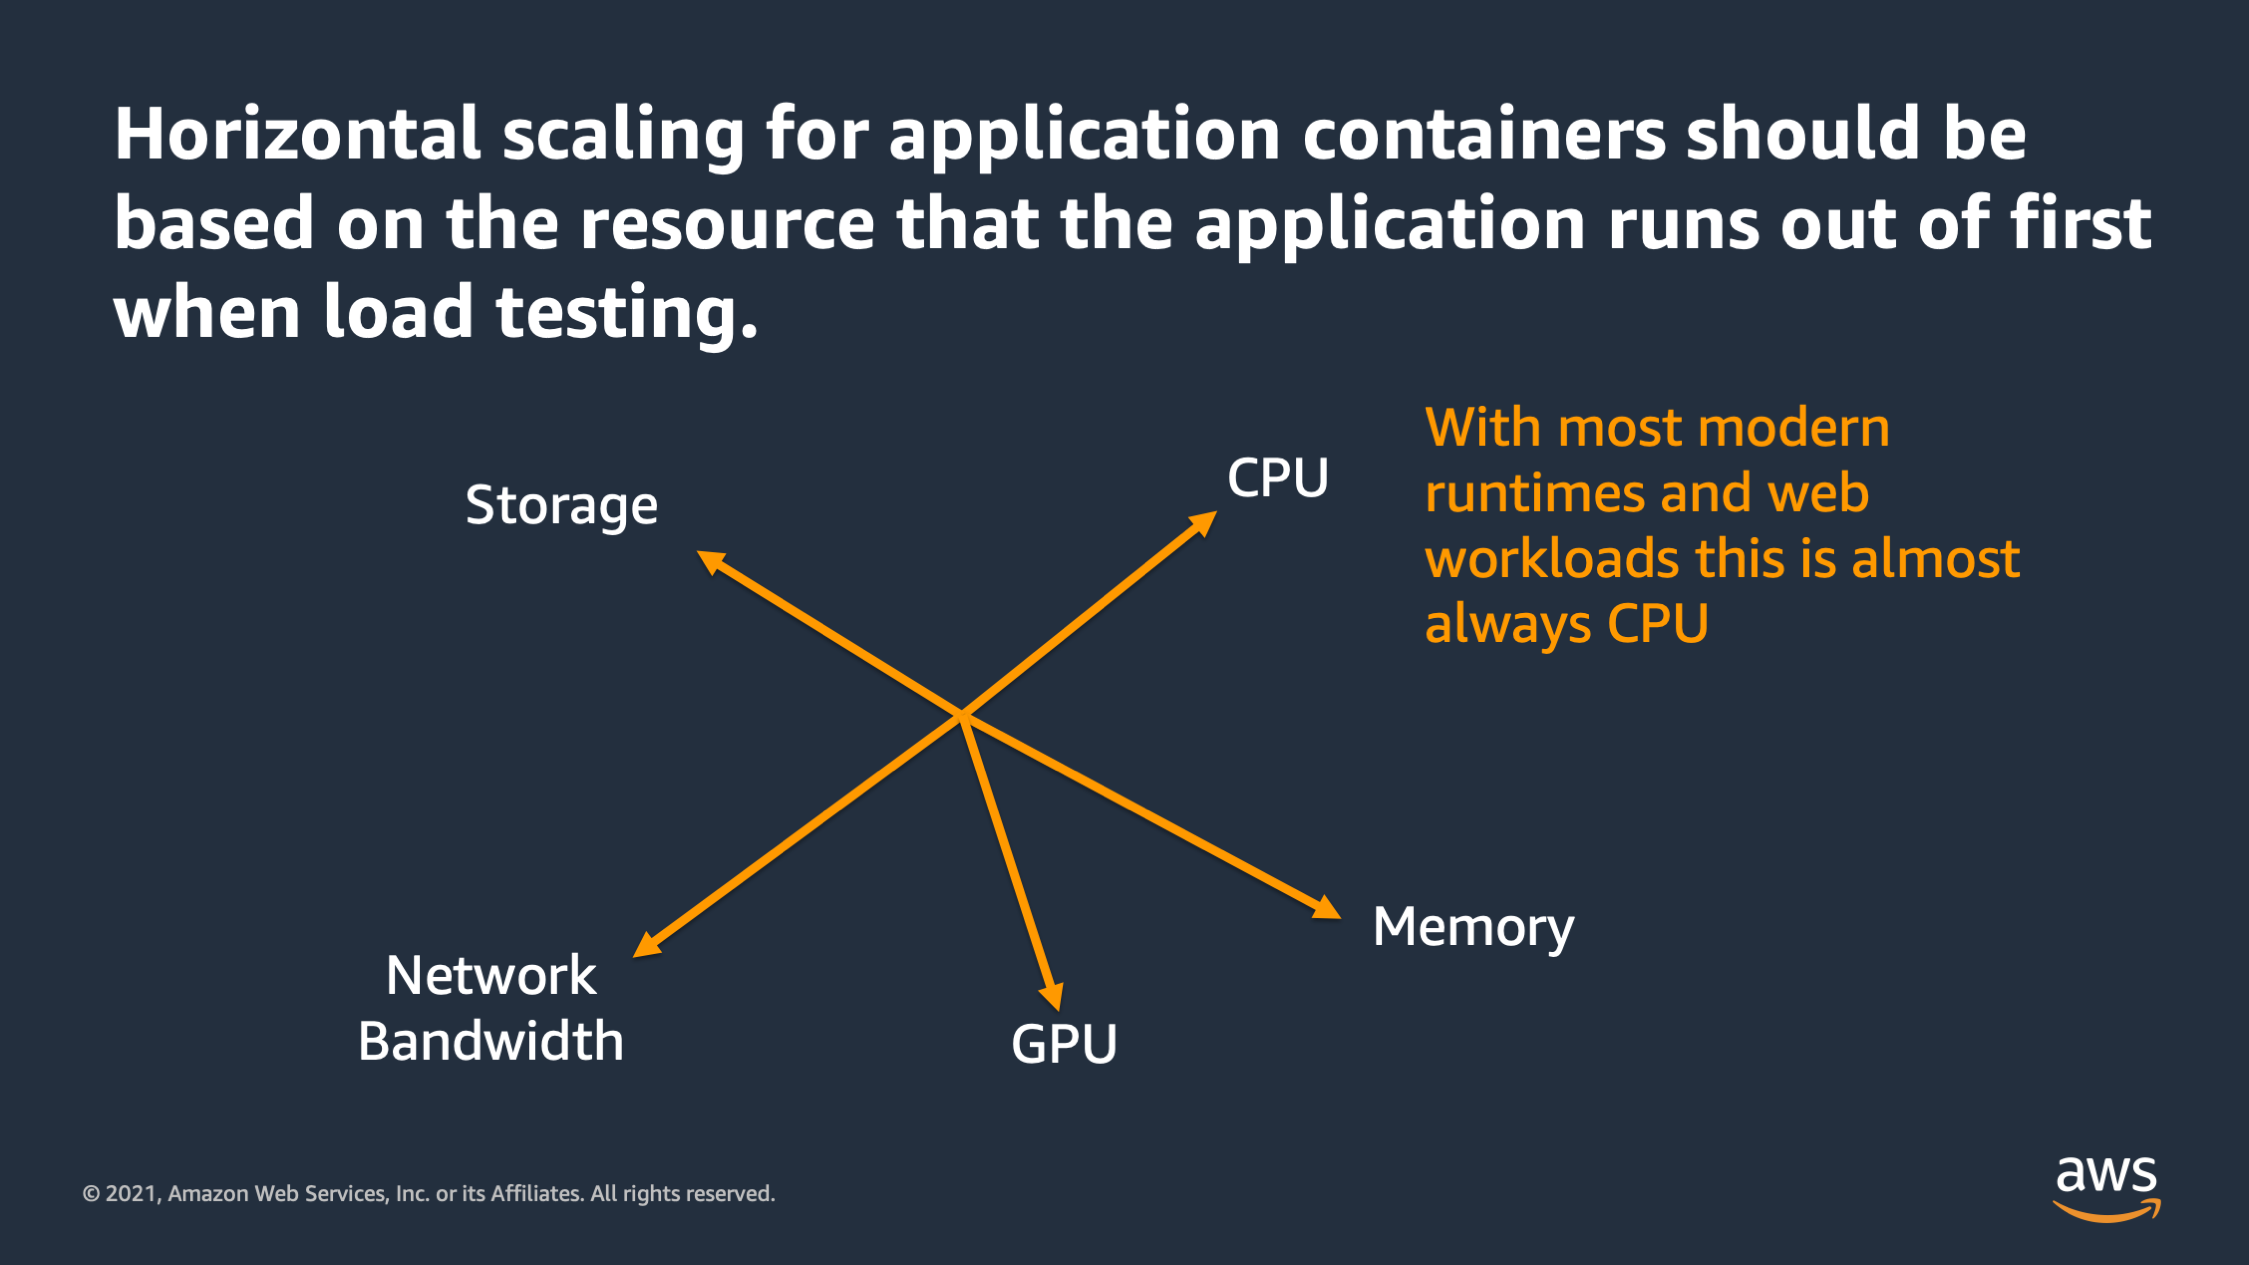
Horizontal scaling, it should be based on the resource that the application funds out first when you load test. And with most runtimes and web workloads what I’ve found is this is almost always CPU. There are some exceptions. Sometimes it’s network bandwidth, but in general most applications run out of CPU first these days.
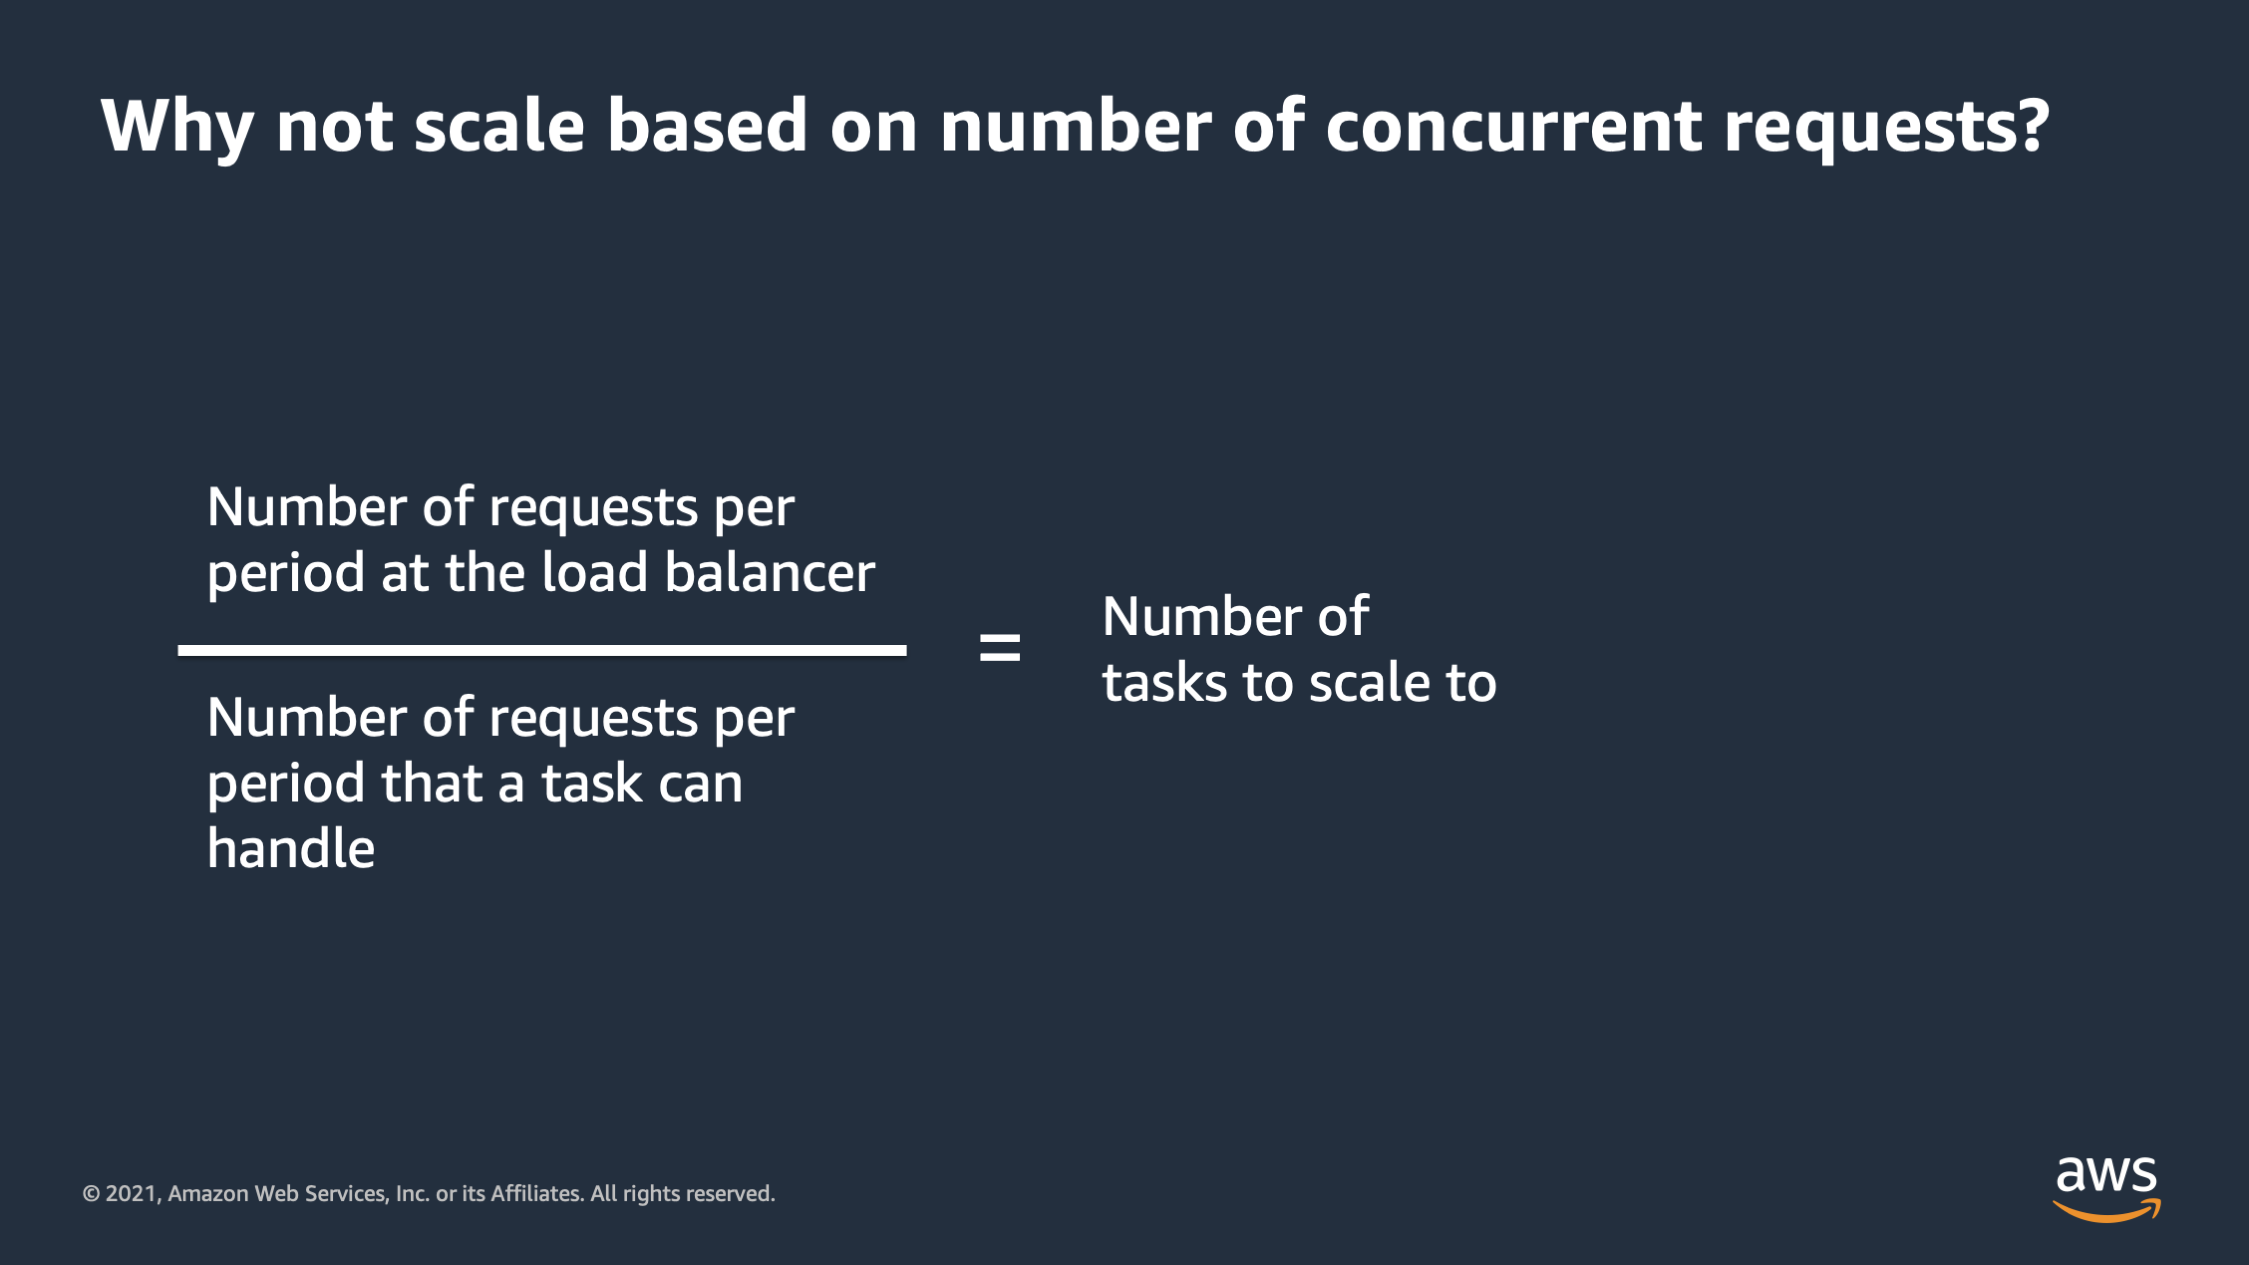
Let’s talk about a couple of alternative ways to scale. This is a current one, like why not scale based on number of concurrent requests? This can work well when you’re first starting out, and in fact, it’s something that we have built in as an option inside of AWS App Runner. And the general strategy is let’s start with the number of requests per period at the load balancer. And let’s take and divide that by the number of requests per period that we think a task can handle. And then that’ll give us the number of tasks to scale to. So this scaling approach, like I said, it can work at small levels, but as you scale out, I would not recommend this approach.
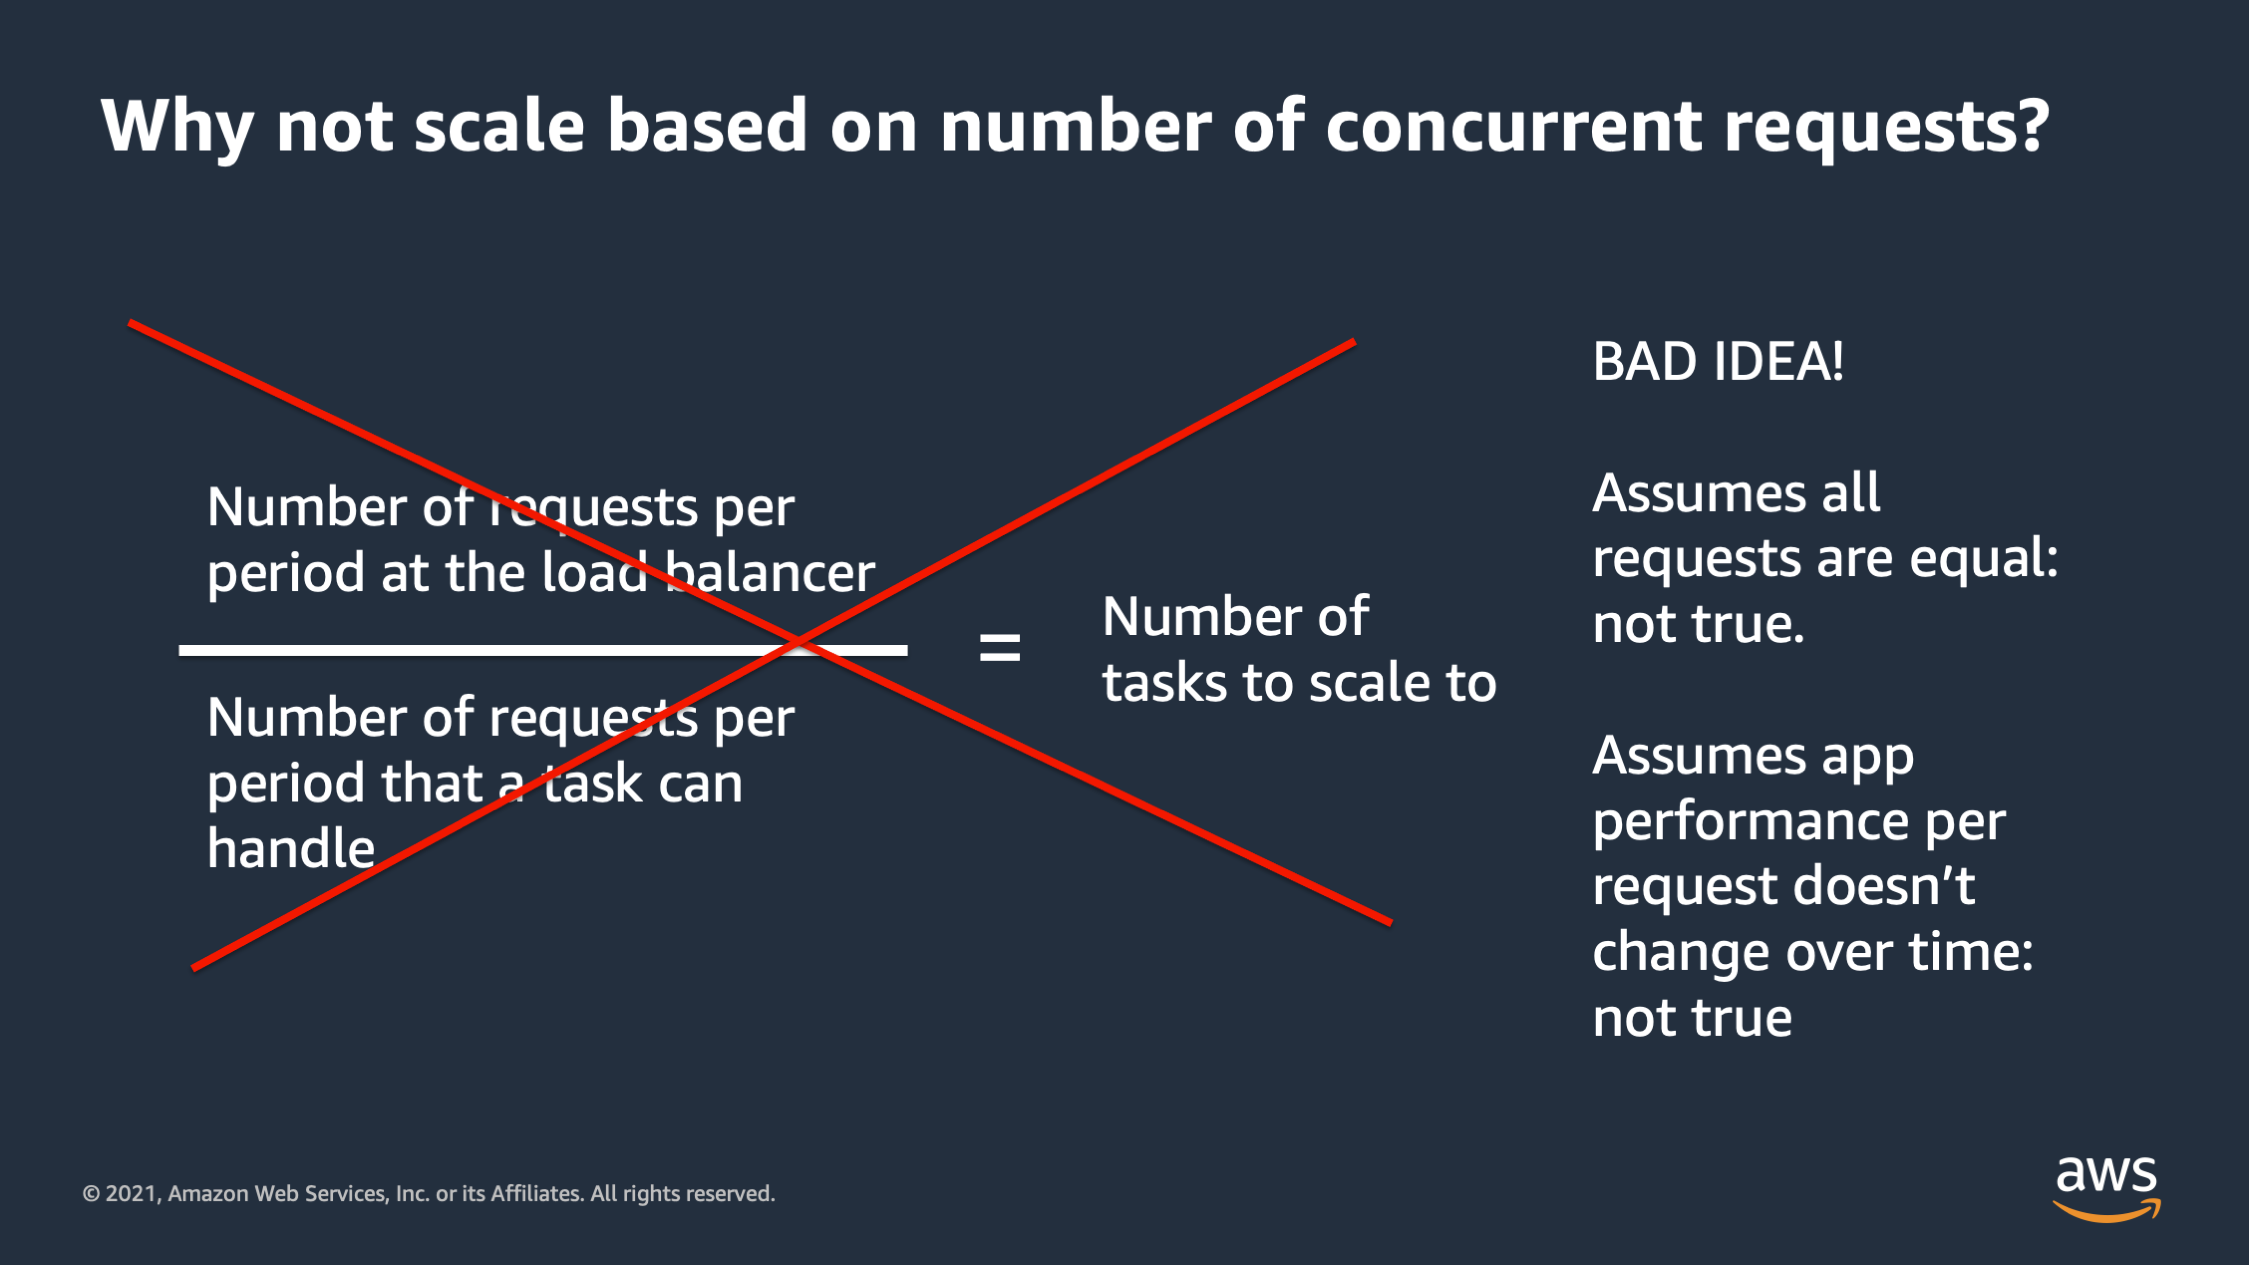
As you move on to managing your own infrastructure, you’re going to realize that this scaling approach assumes that all requests are equal and that’s not true. Oftentimes especially if a monolithic application, you may have some requests that are orders of magnitude heavier in terms of resource consumption than others. And this also assumes that app performance per request, doesn’t change over time, and that’s also not true.
There are situations where as the number of requests increases, the performance per request actually decreases, in some cases, as the database becomes more burdened. Or as programmers actually changed the code that executes when a request happens, they may optimize something or they may introduce a new feature that introduces a performance issue. You end up with a situation where you are scaling the number of tasks to scale to doesn’t work anymore, and this situation can go bad really quickly.
So I wouldn’t really recommend this if you have large scale unless your application is extremely stable, and you have a microservice environment where everything is super uniform.
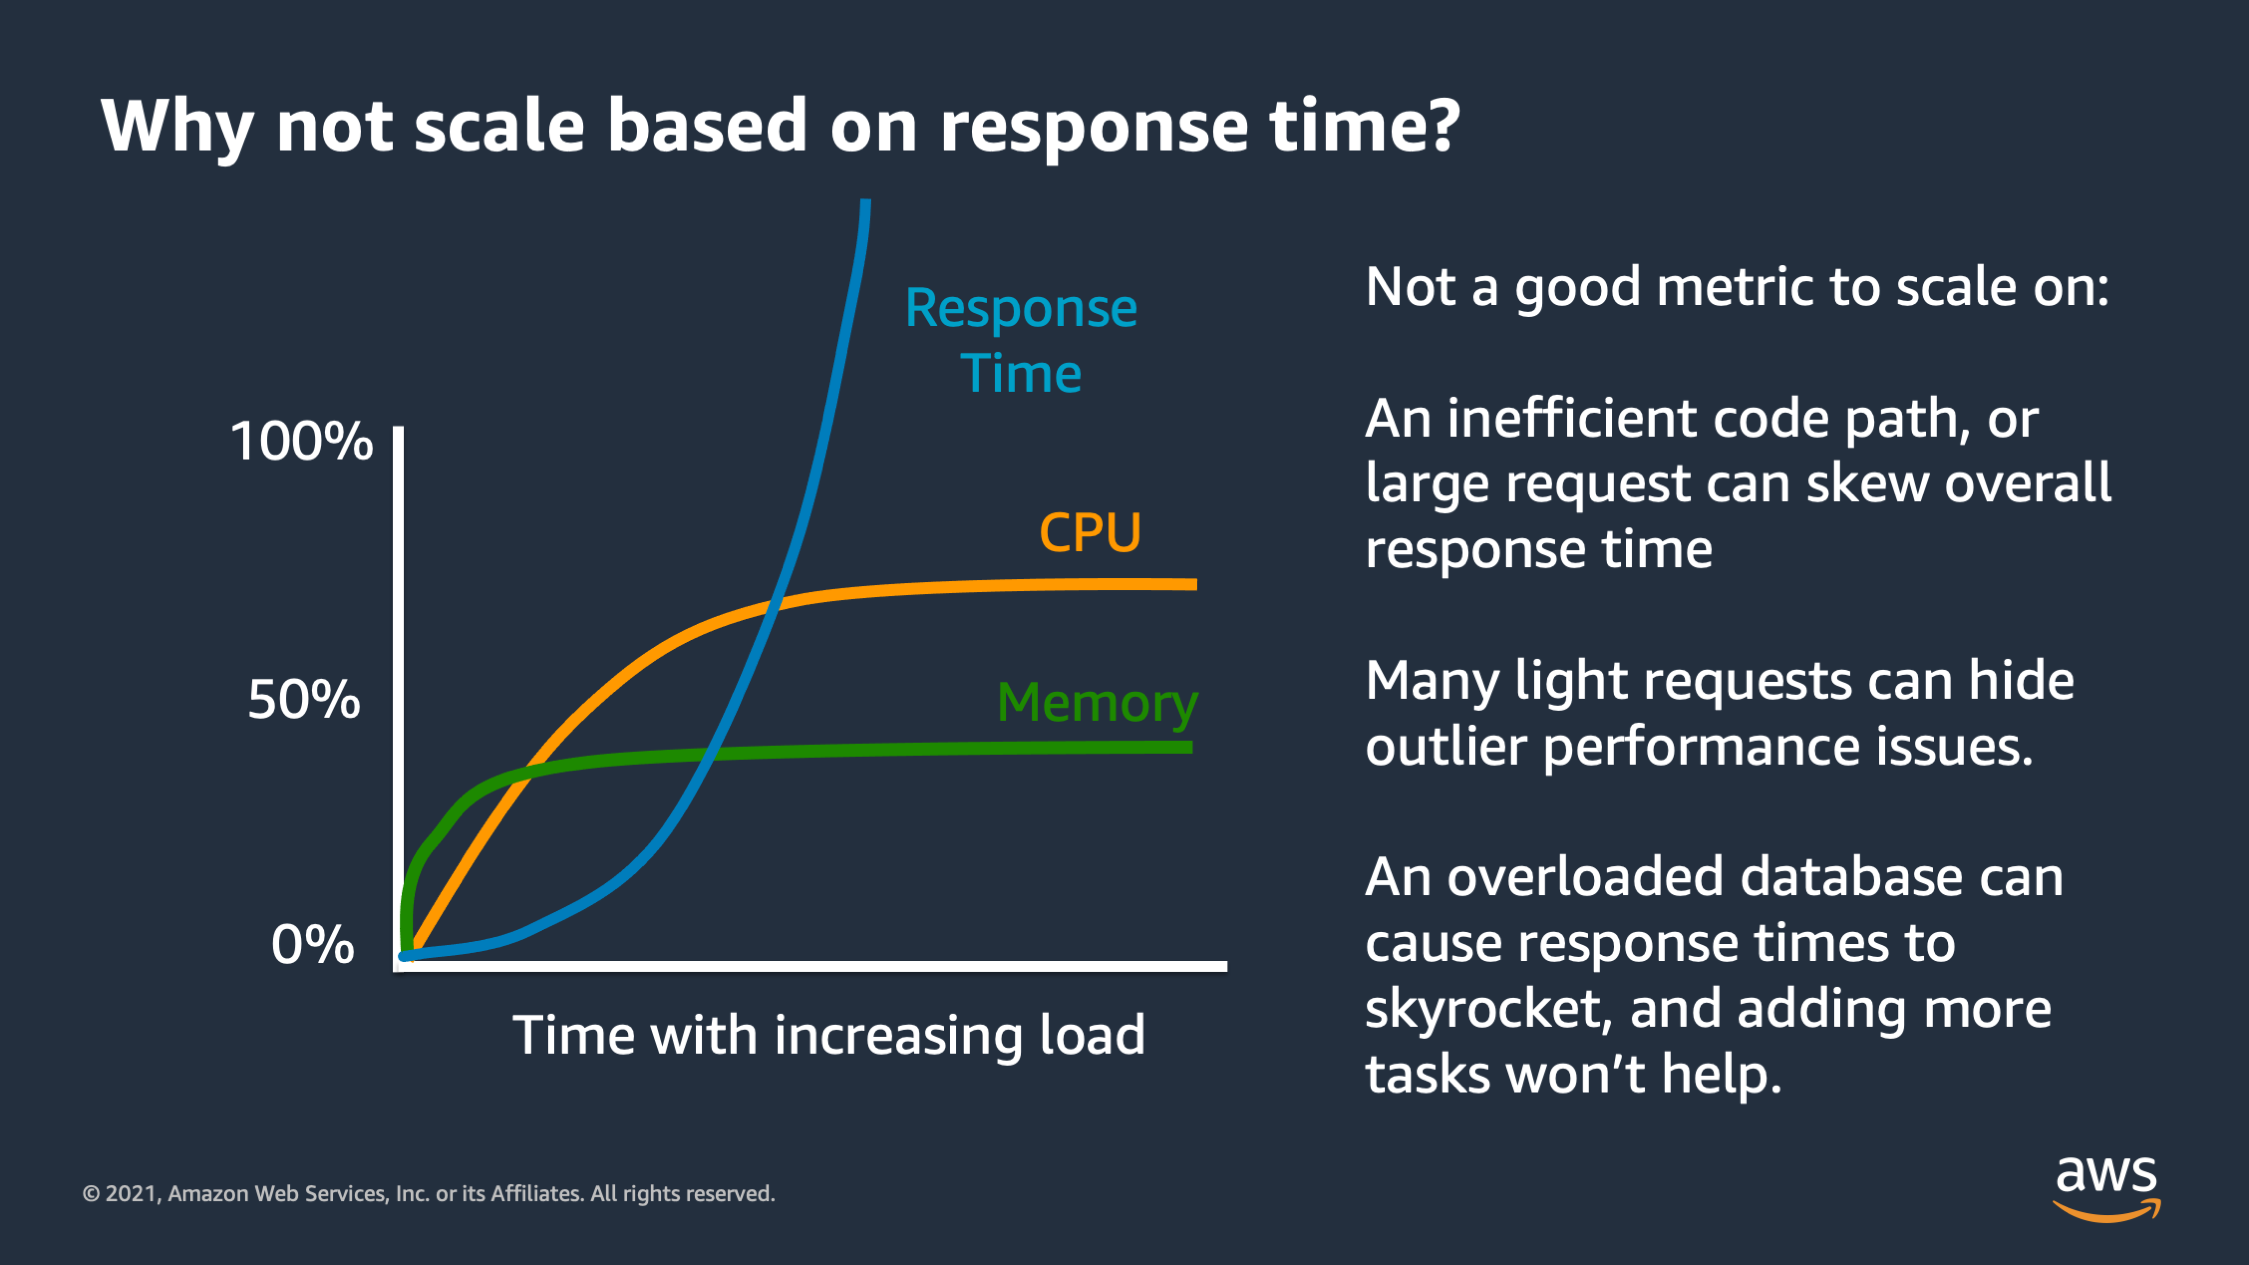
Let me highlight another pitfall for scaling, and that is scaling based on a response time. So this is also not a good metric to scale on because response time isn’t necessarily linked to the application and scaling won’t necessarily fix the response time.
In particular, if you have an inefficient code path or a really large request that takes a long time, for some reason, that can skew your overall response time and make it look like you need to scale when you don’t actually need to. Conversely you may have performance issues, but you’re serving a bunch of really light requests that respond extremely quickly. And these light requests bring down the average response time and make it seem like performance is good when actually you have performance issues.
And then finally you may have a downstream service or database that’s overloaded, and it’s contributing to really long response times. But if you were to respond to that by scaling out the application tier it won’t help the situation. In fact, that may actually make it much worse by launching more copies of the application connected to an already overloaded database.
So this can also be a very dangerous metric to scale on.
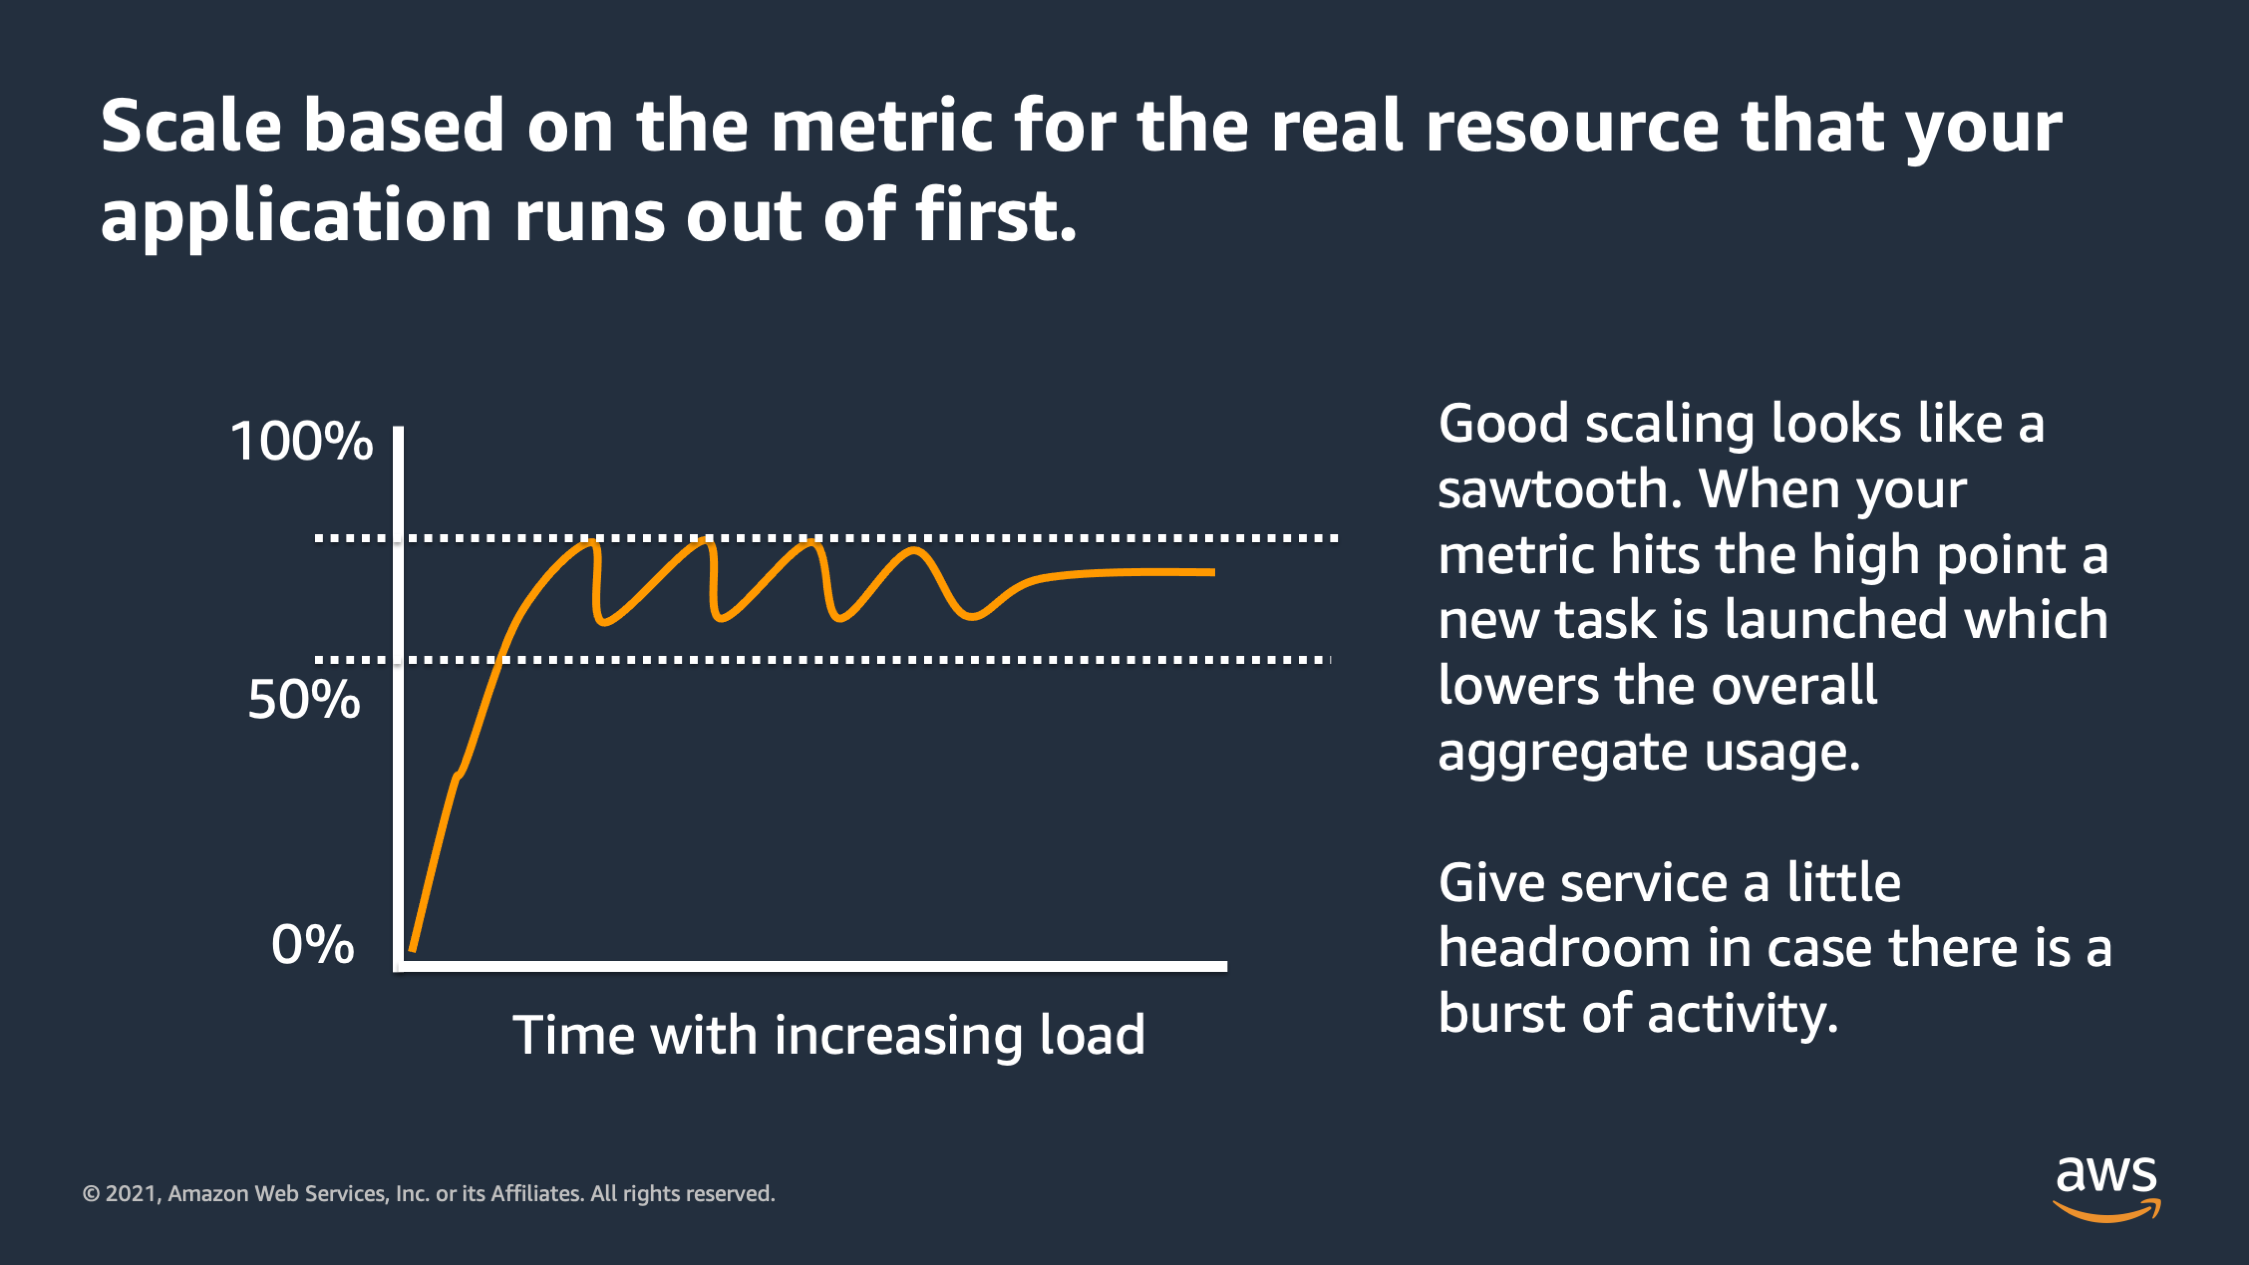
You should always scale based on the metric for the real resource that your application runs out of first. And when it’s working properly, you’ll see basically a sawtooth. It goes up and down. When it reaches the high point a new task is launched, and it reduces the aggregate utilization. If it reaches too low, it’ll stop a task and then go back up. Always give the service a little bit of head room in case there was a burst of activity and your scaling can’t respond fast enough.
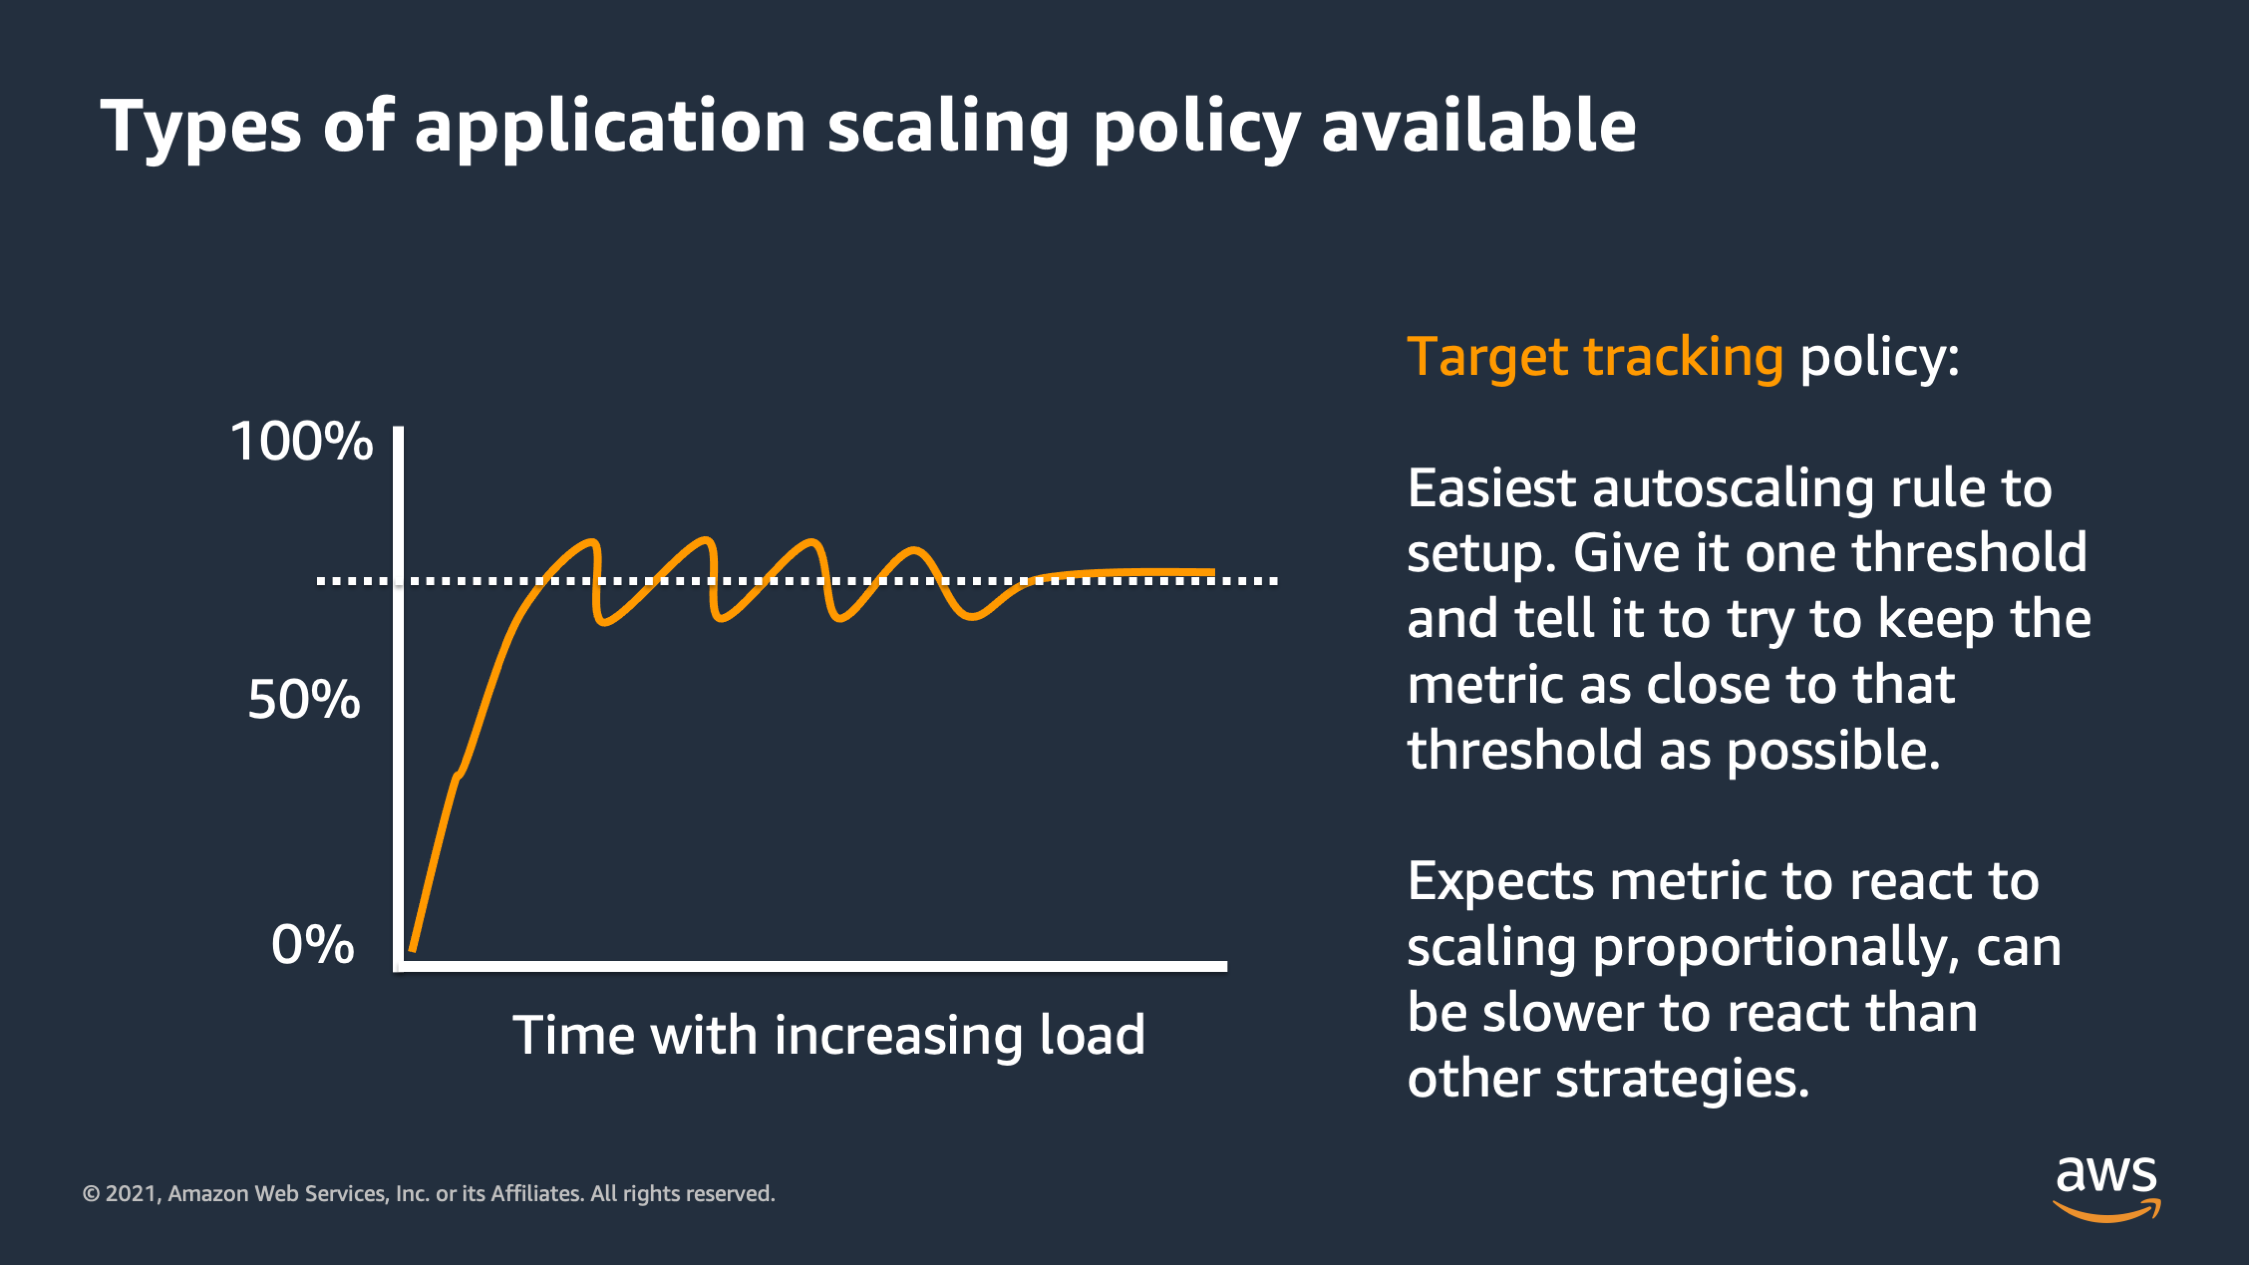
Now there’s three different types of horizontal scaling. You can use three different types of strategies. The first is a target tracking policy. So this is the easiest type of scaling and set up. You give it one number and you say: “Try to keep the aggregate resource consumption near this number.” And it’ll scale up and down automatically to try to keep it close to that threshold.
The downside is this can be a little bit slow to respond sometimes, and also expects that your resource utilization metric is going to respond proportionally when you add or remove tasks. That’s not always the case.
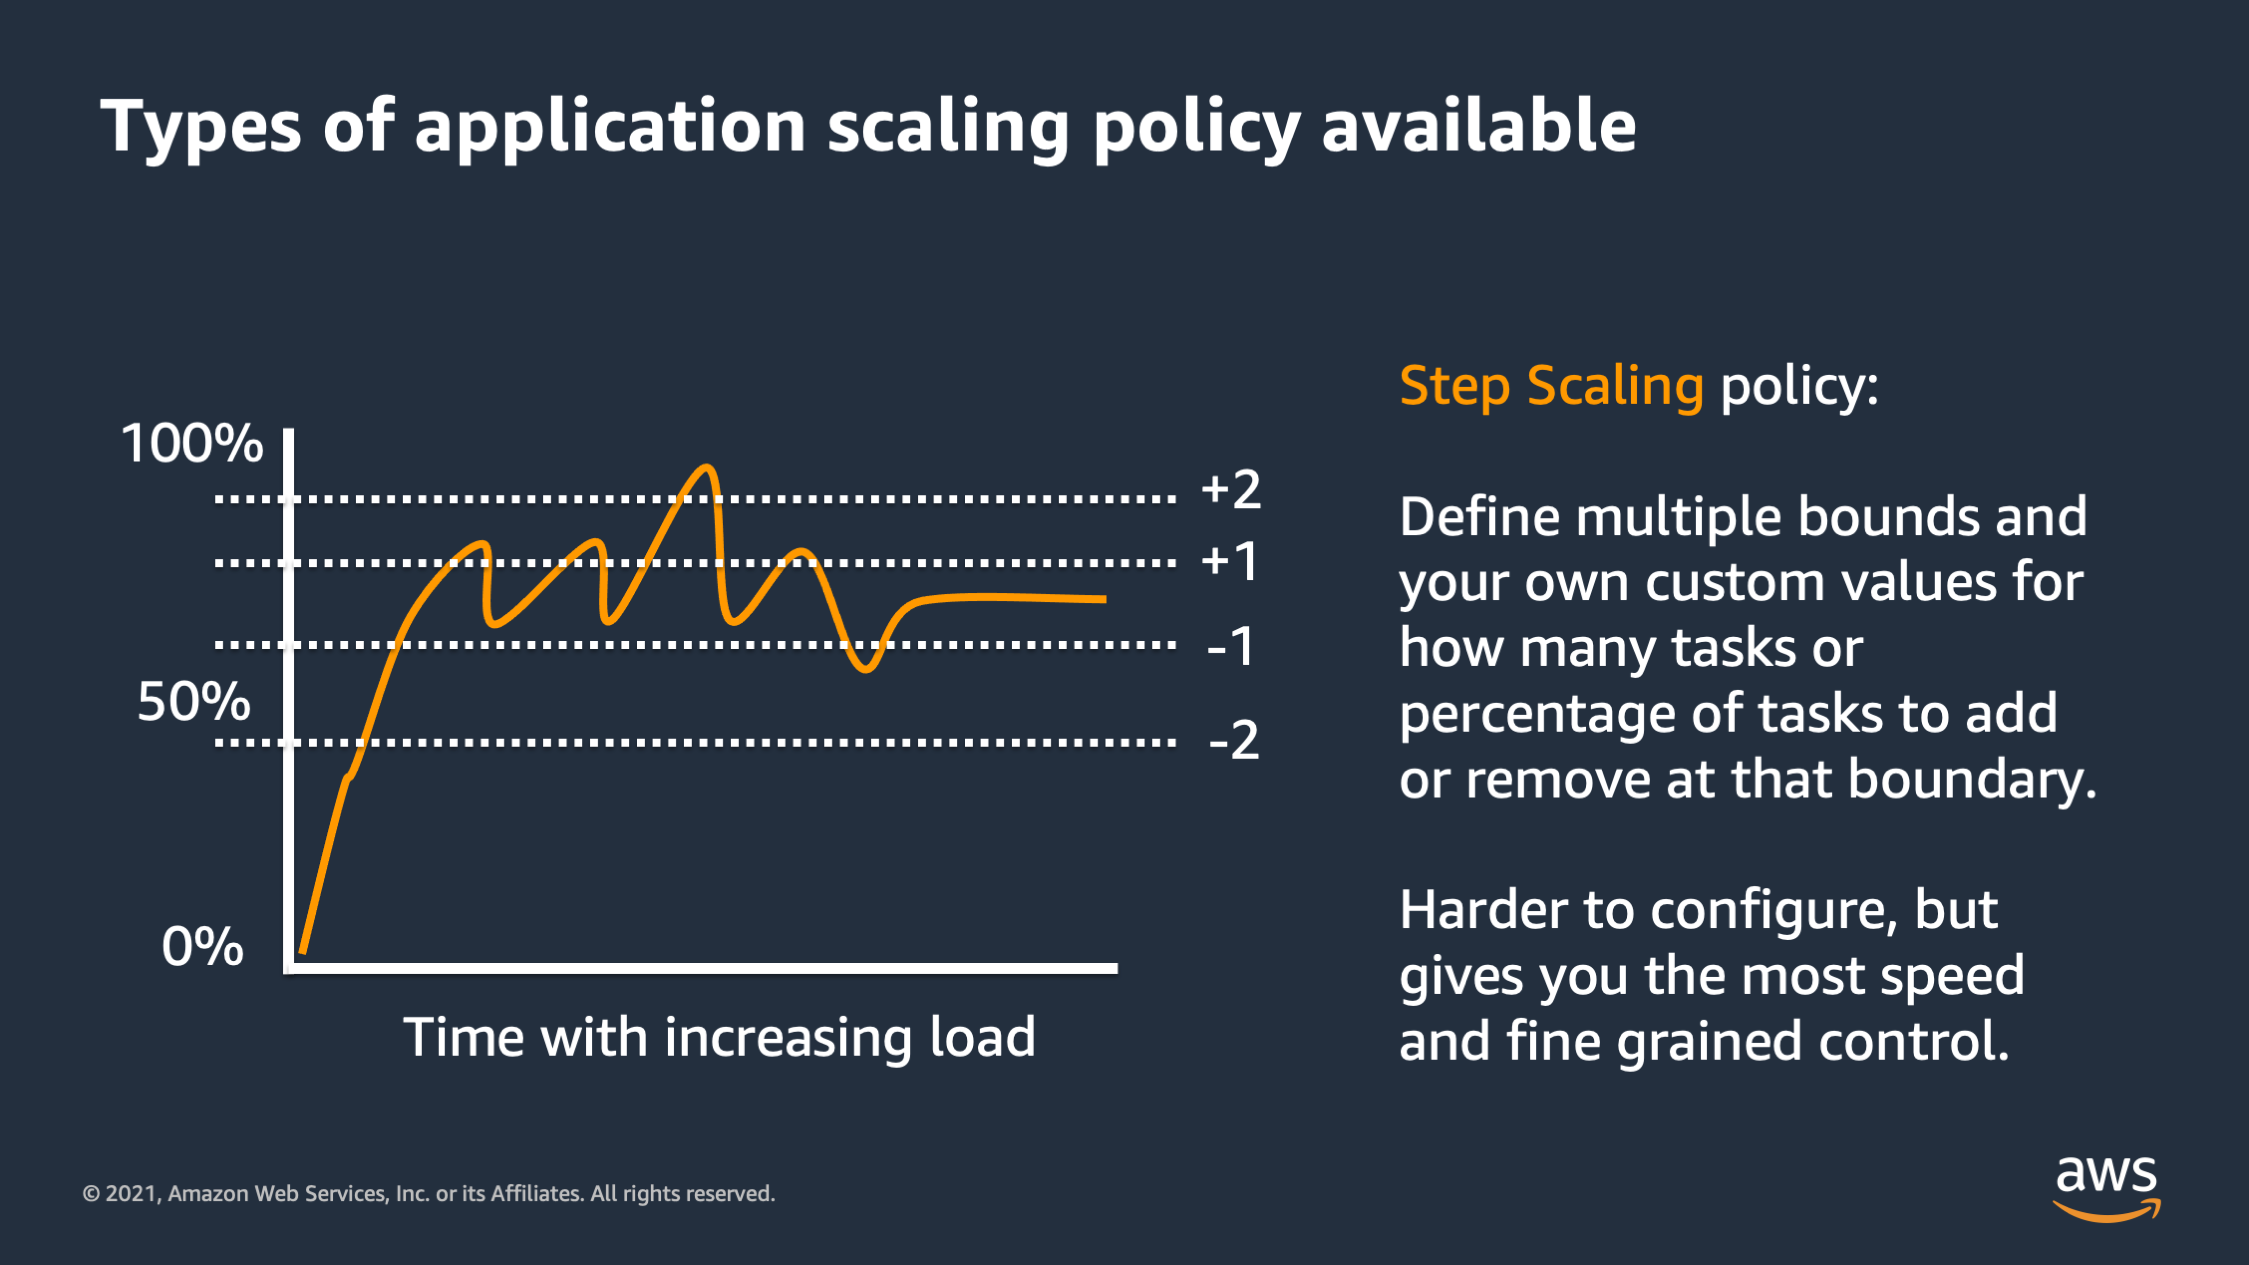
The second type is step scaling. So step scaling, you define your own custom bounds. And you say, if the resource consumption, reaches this level, add this many tasks or this many percentage of tasks, if it reaches this level, remove this may task and this many percentage of tasks.
So this is great for giving you the most control over how your infrastructure responds to scaling.
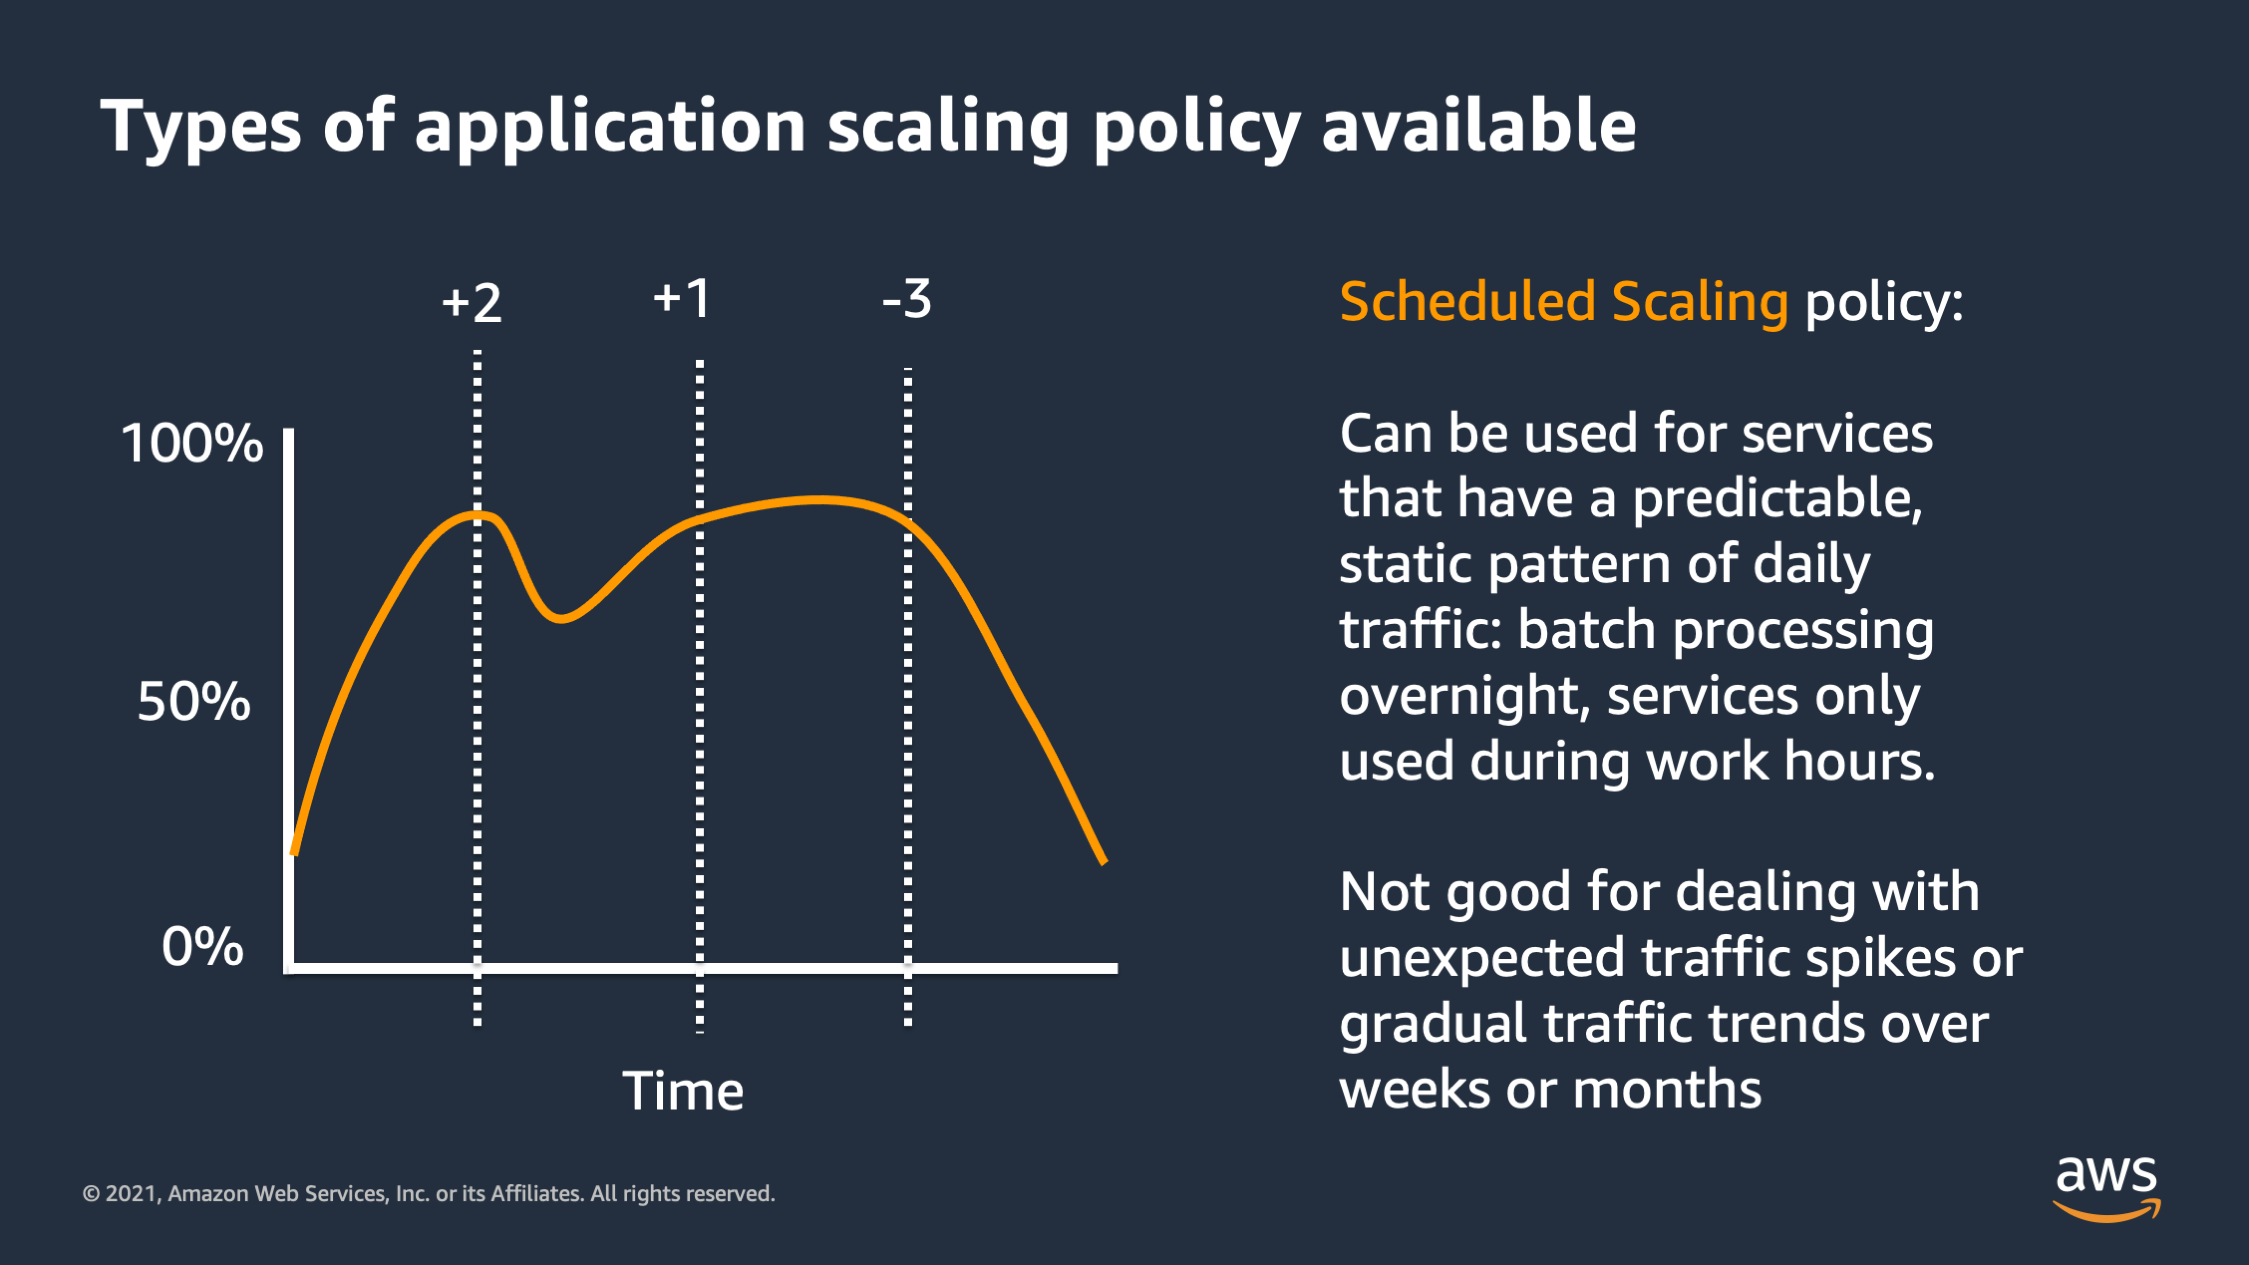
And then the last type is scheduled scaling. So with this approach, you specify specific times during the day that you would like to scale up or scale down. This is great for predictable traffic patterns like batch traffic overnight, or services are only used during work hours, but it’s not good for handling unexpected traffic spikes. And it’s not good for gradual traffic trends. Like if you’re still signing up lots of new users and your traffic is gradually increasing over weeks and months.
So we talked about horizontal scaling. We talked about vertical scaling. Let’s talk about the cluster capacity scaling. Because as you launch more containers, which you’re going to use, you need more compute capacity to actually run those containers.
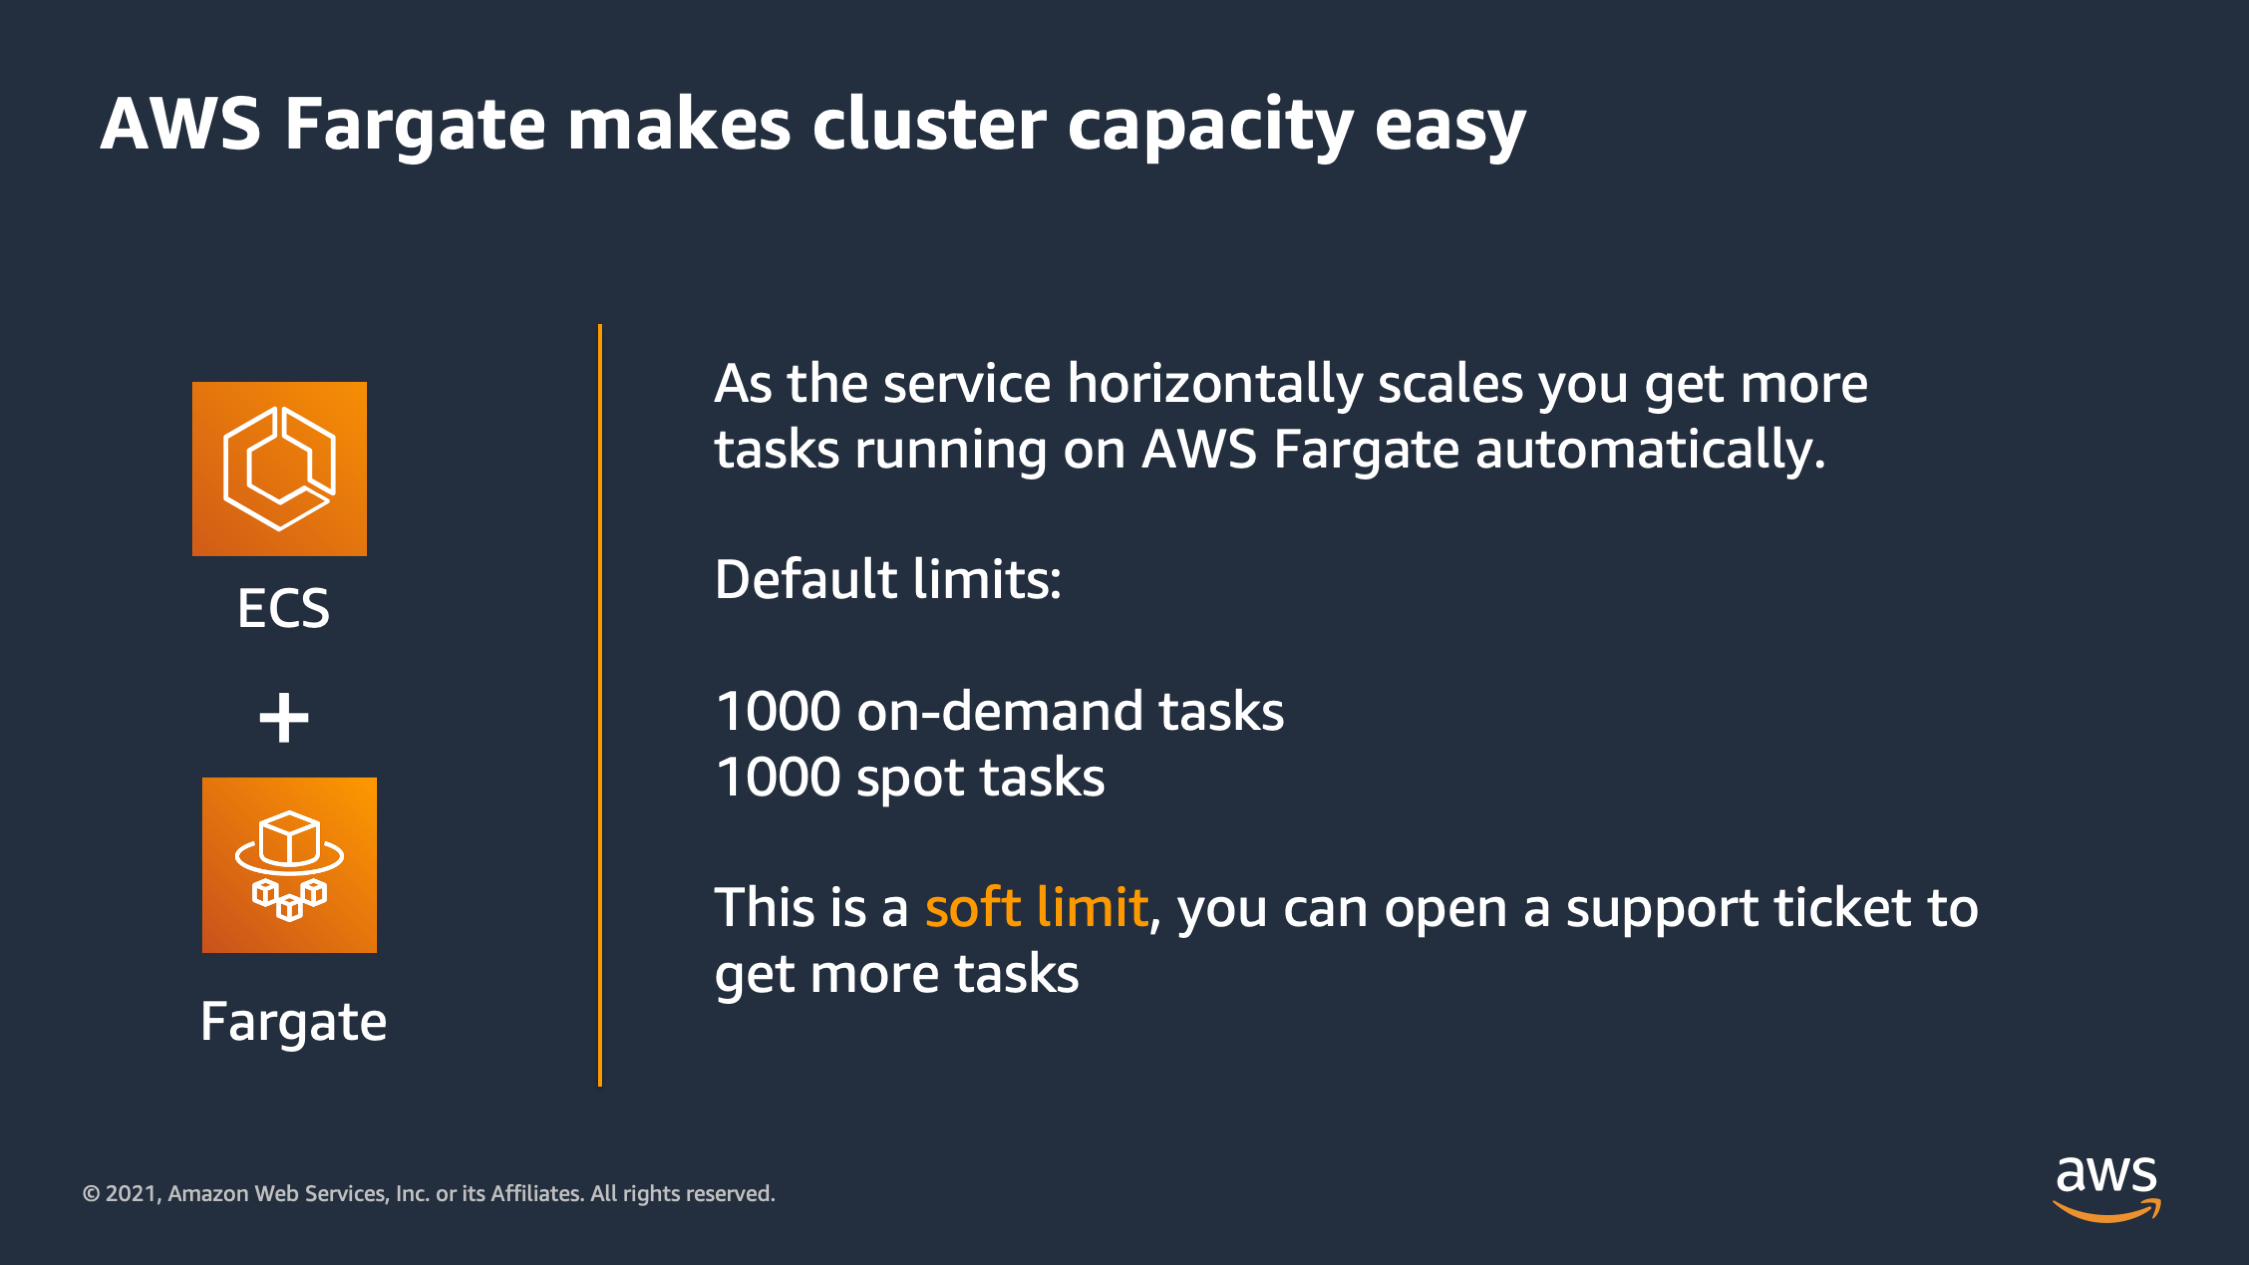
So the first thing is to know is that AWS Fargate makes cluster capacity easy. With AWS Fargate you don’t have to worry about EC2 instances and how much capacity. Instead you just get tasks running automatically. There’s two limits you should be aware of though. The first is that there’s 1000 on-demand tasks and 1000 spot tasks by default, but this is a soft limit. So you can talk to support if you would like to have more AWS Fargate tasks running.
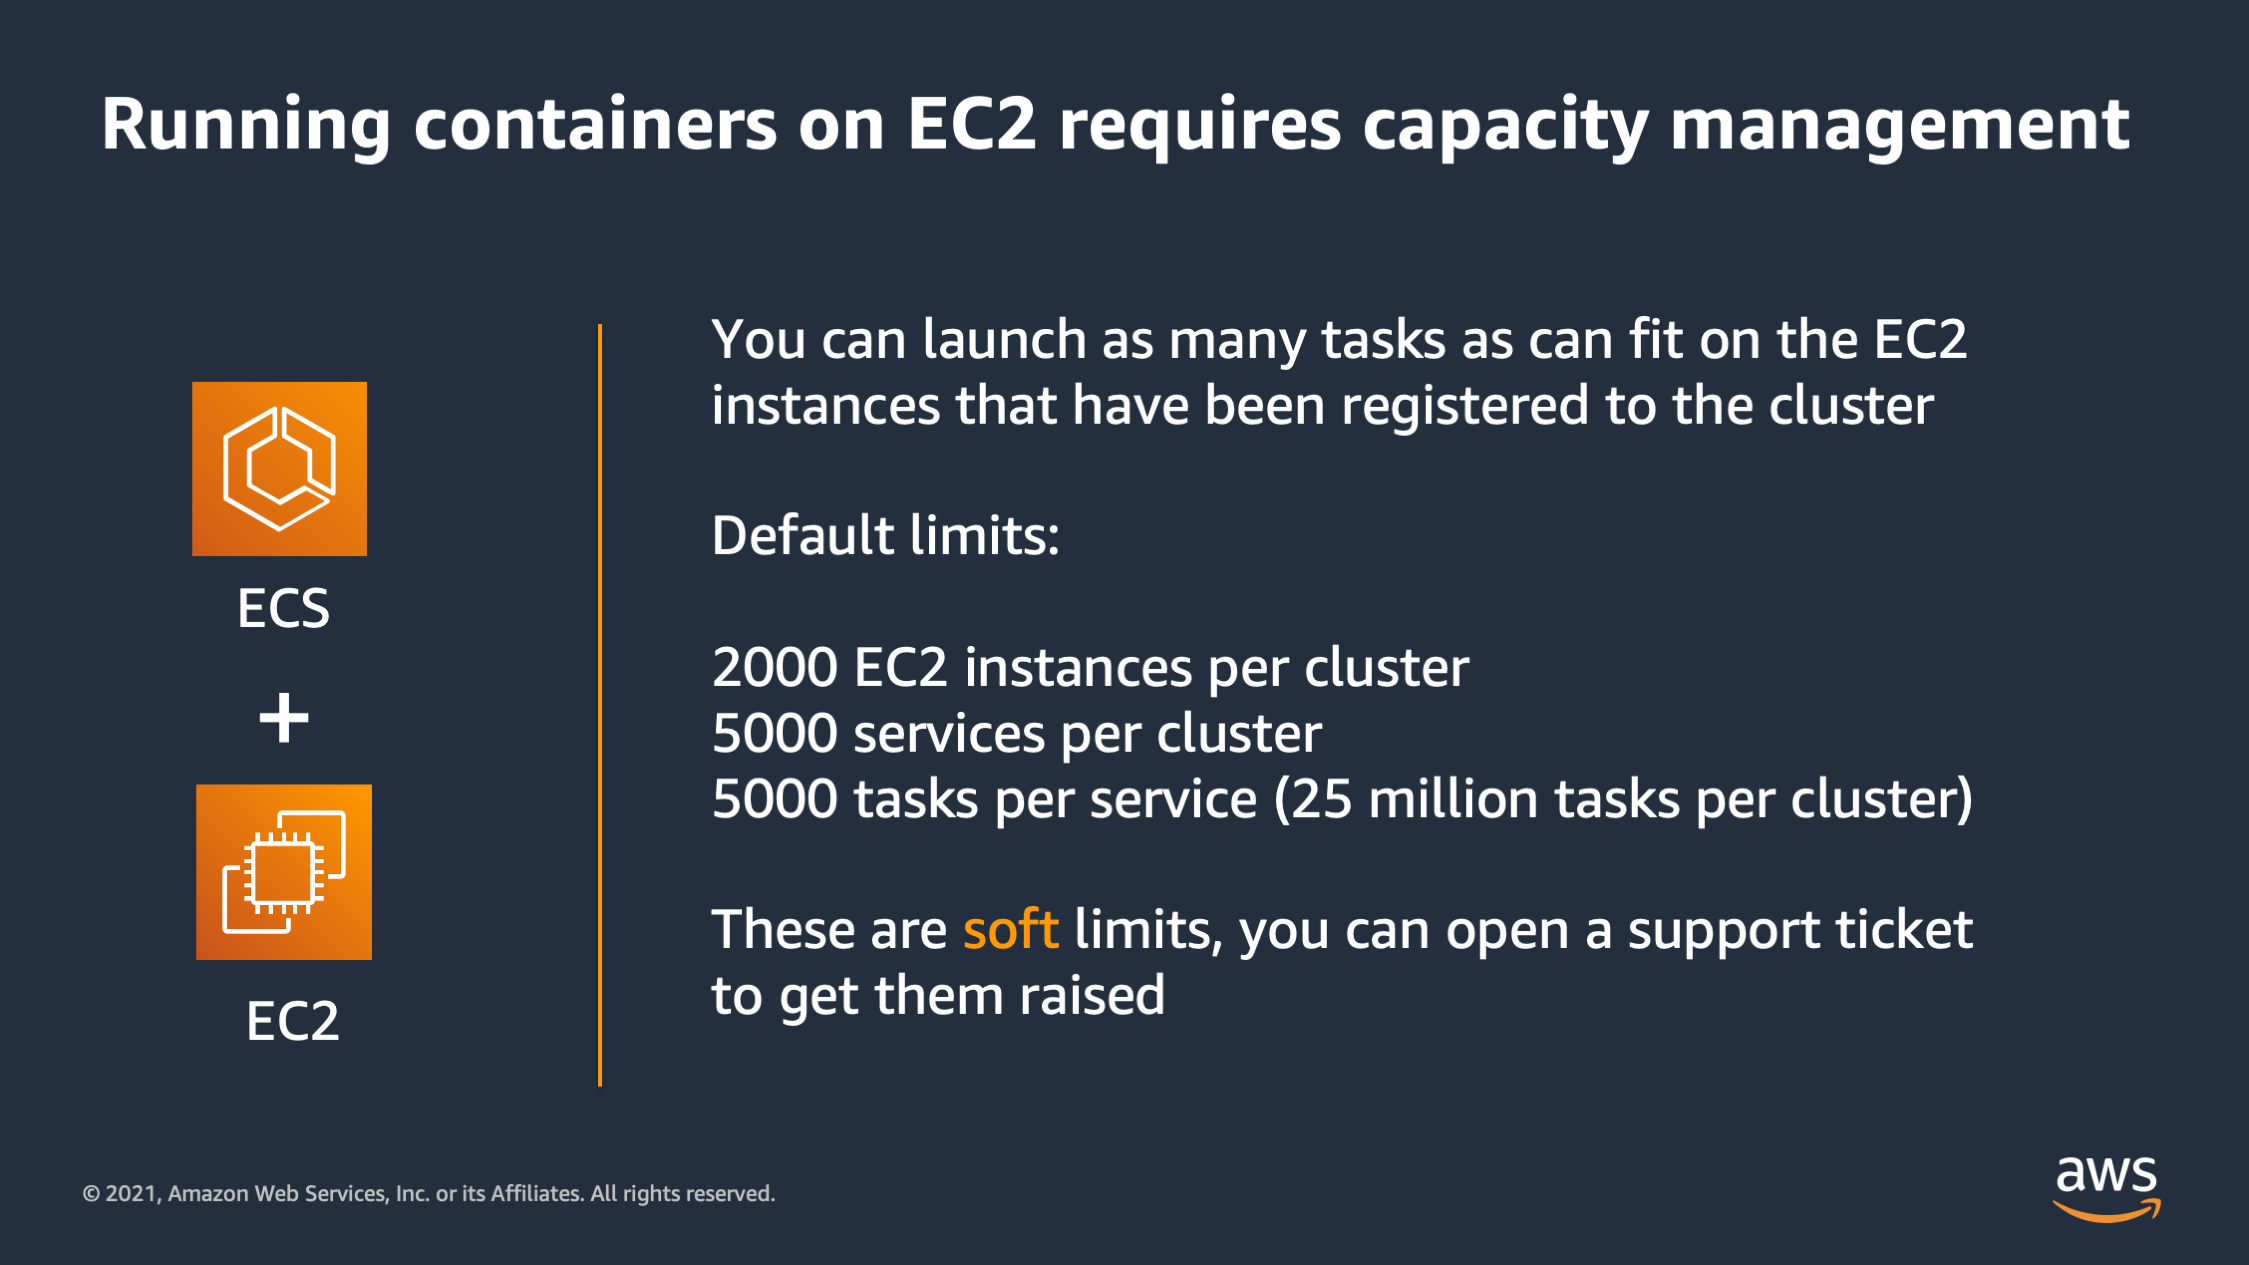
And then for EC3, it’s a little more complicated. You have to actually launch EC2 instances to host your tasks on. And the default limits are like this: 2000 EC2 instances per cluster, 5,000 services per cluster and 5,000 tasks per service. So yes, it does mean you could actually technically launch twenty-five million tasks per cluster on ECS on EC2 without opening a support ticket.
Now, if you do need more than that or if you want more instances probably to run 25 million tasks, then these are soft limits, so you can open a support ticket to get these limits raised even more.
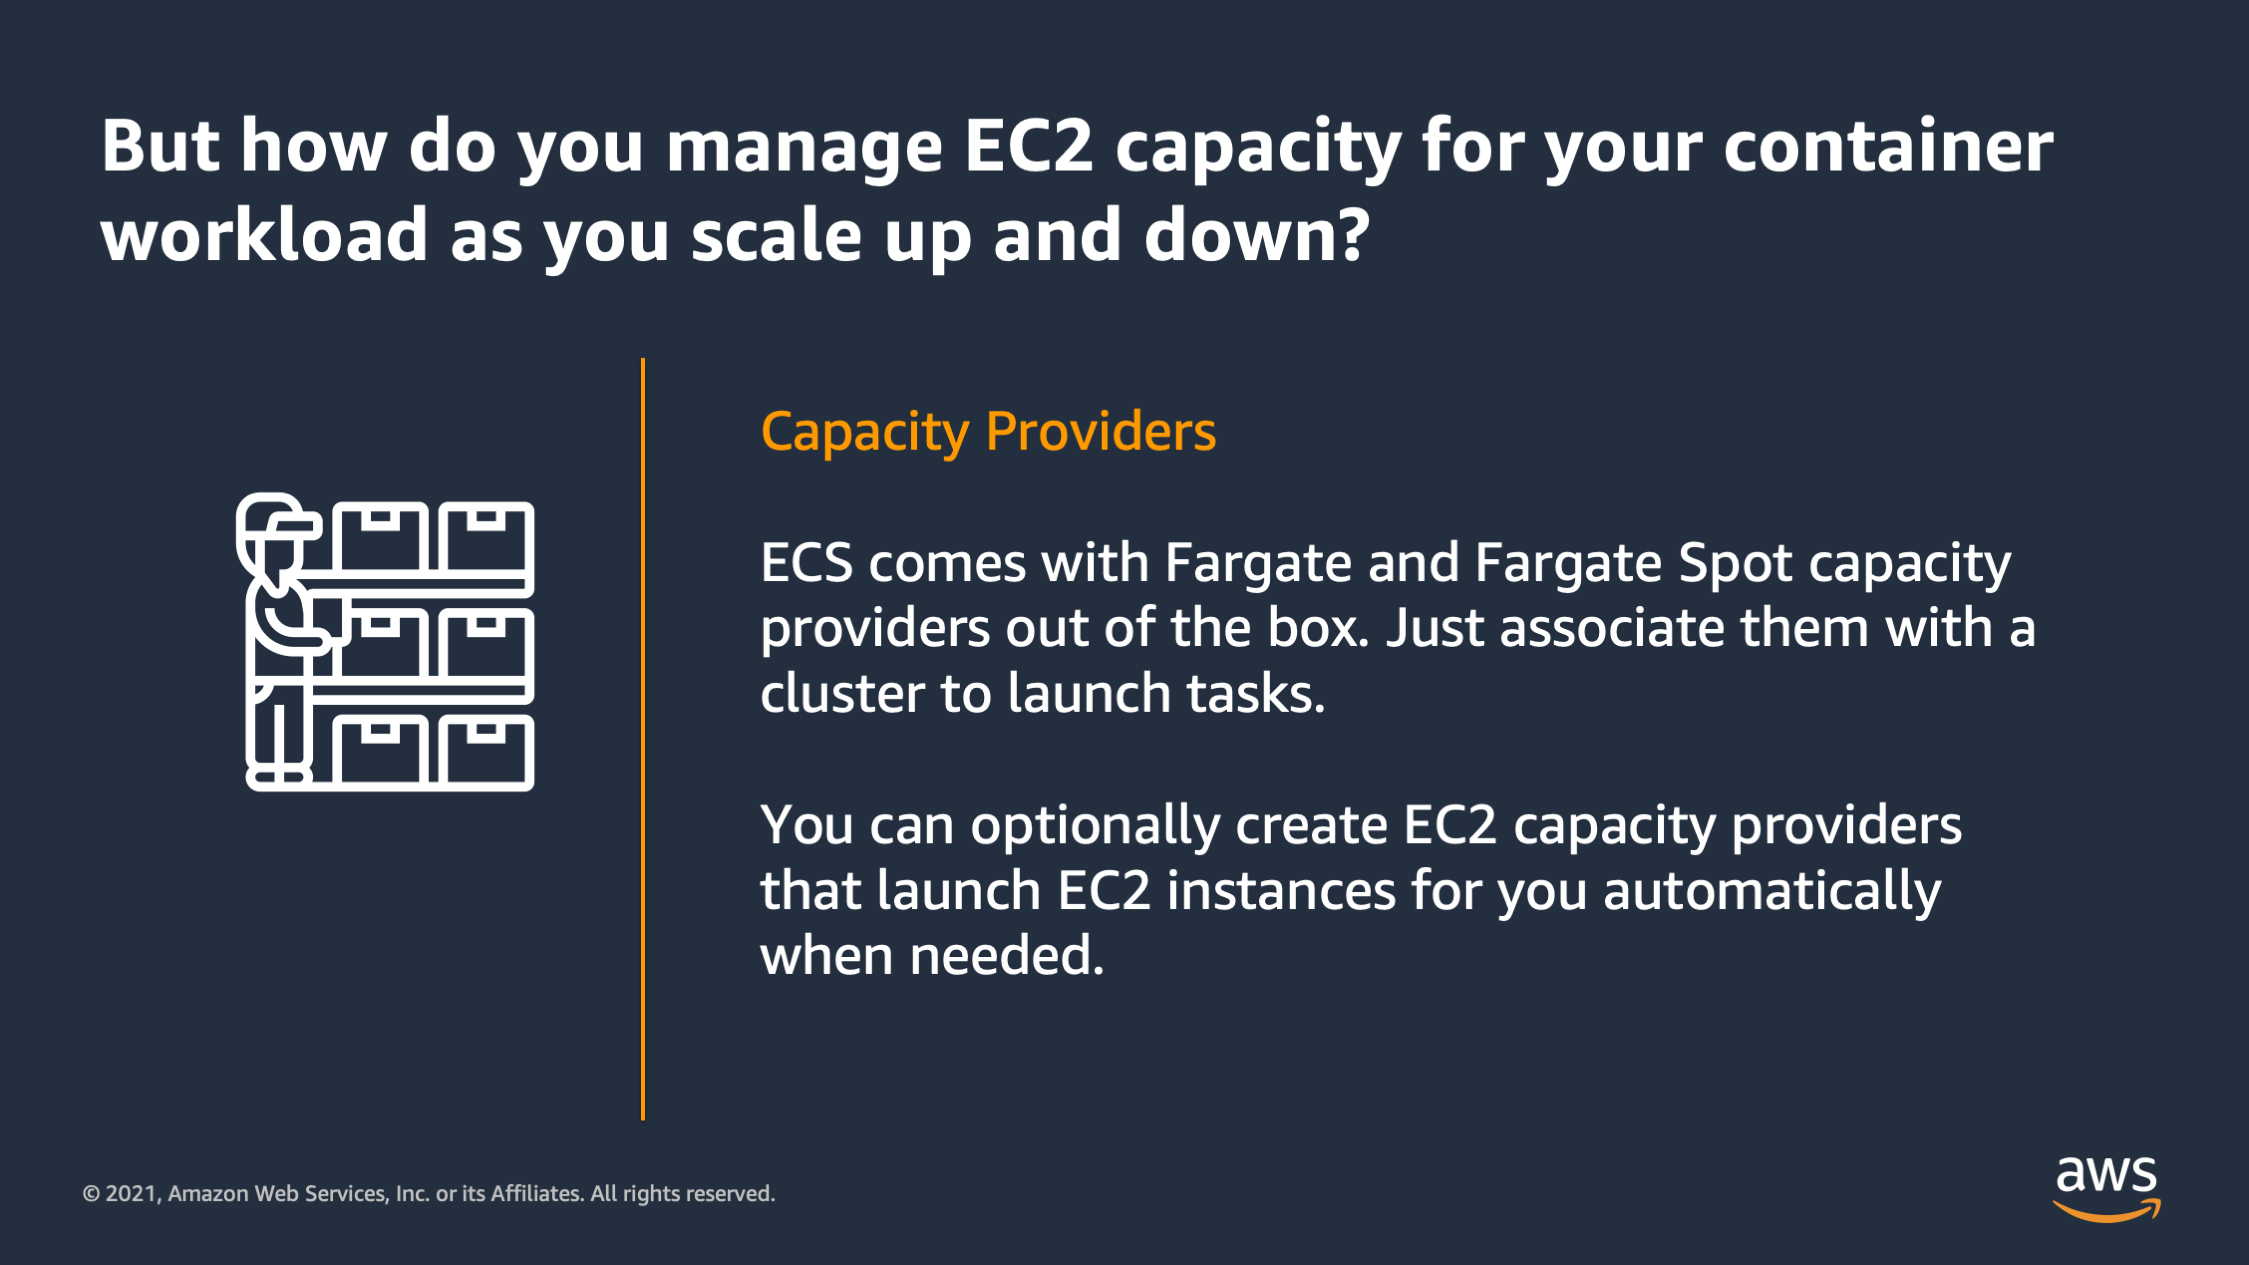
The last thing I want to introduce is capacity providers. So this solves a problem of how do you manage the EC2 capacity for a container workload as you scale the number of containers up and down. ECS actually comes with capacity providers out of the box: Fargate and Fargate Spot. You can just associate them with the cluster if you want to launch tasks, and you can optionally create EC2 capacity providers that launch EC2 tasks automatically when needed.
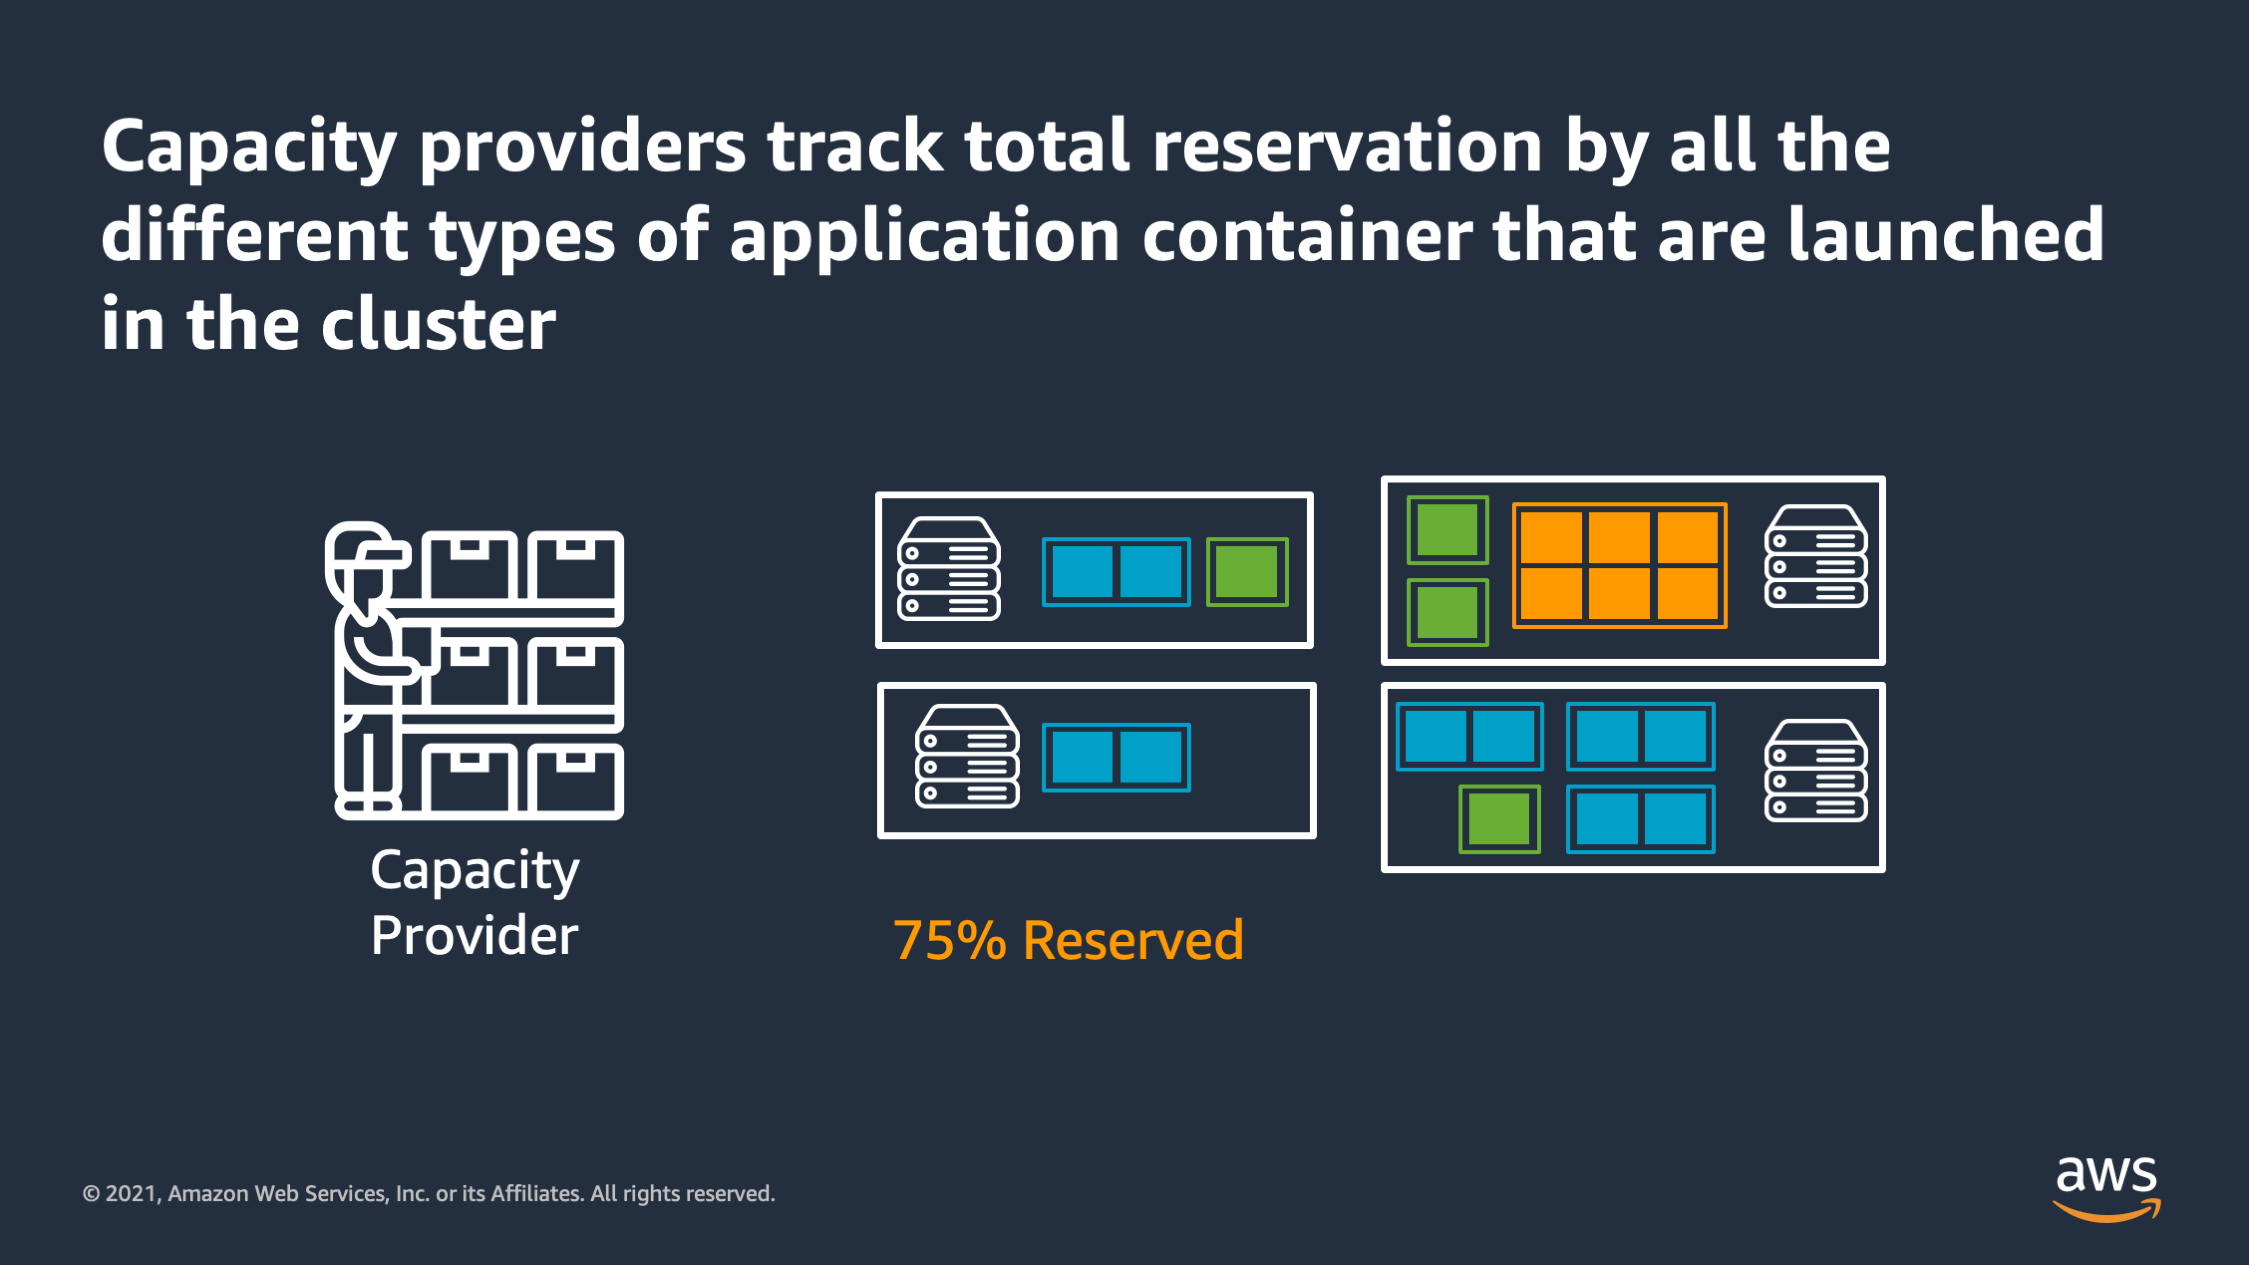
So the way they work is capacity providers track the total reservation by all the different types of application tiers on the cluster to come up with a total reservation metric. And it tries to keep that reservation metric within bounds that you specify. So here’s how it works.
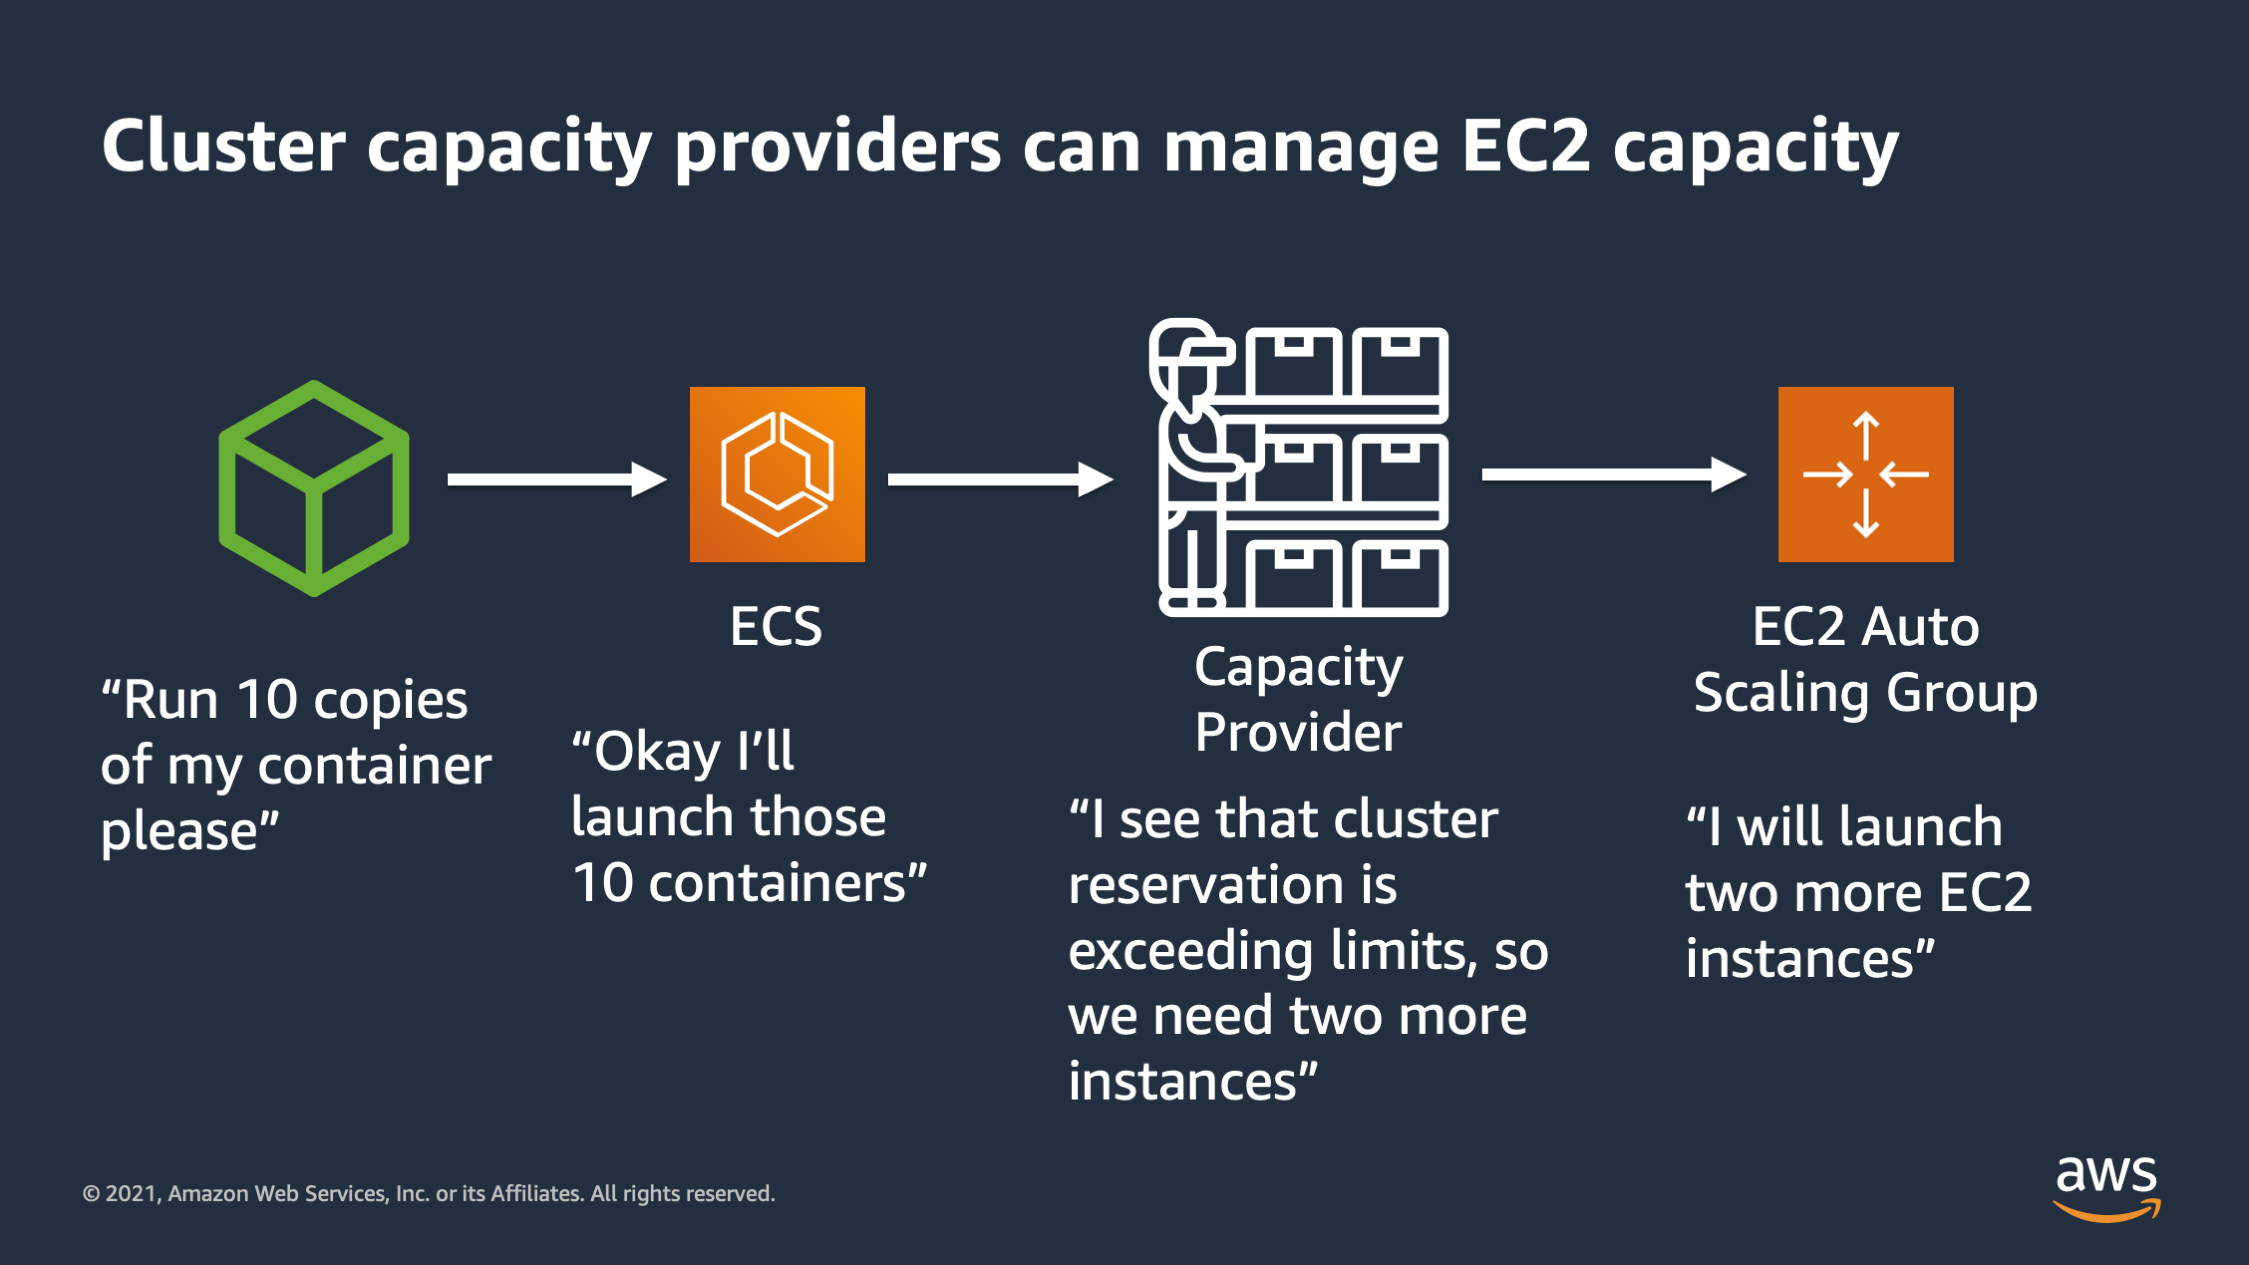
I tell ECS, I would like to run 10 copies of my container. ECS says, okay, I’ll launch those 10 containers. The capacity provider says, I see that the cluster reservation is exceeding 75%. So I calculate that I’m gonna need to launch two more, EC2 instances in order to maintain a little bit of headroom inside the cluster, and then it talks to the EC2 auto scaling group to actually launch those two more EC2 instances.
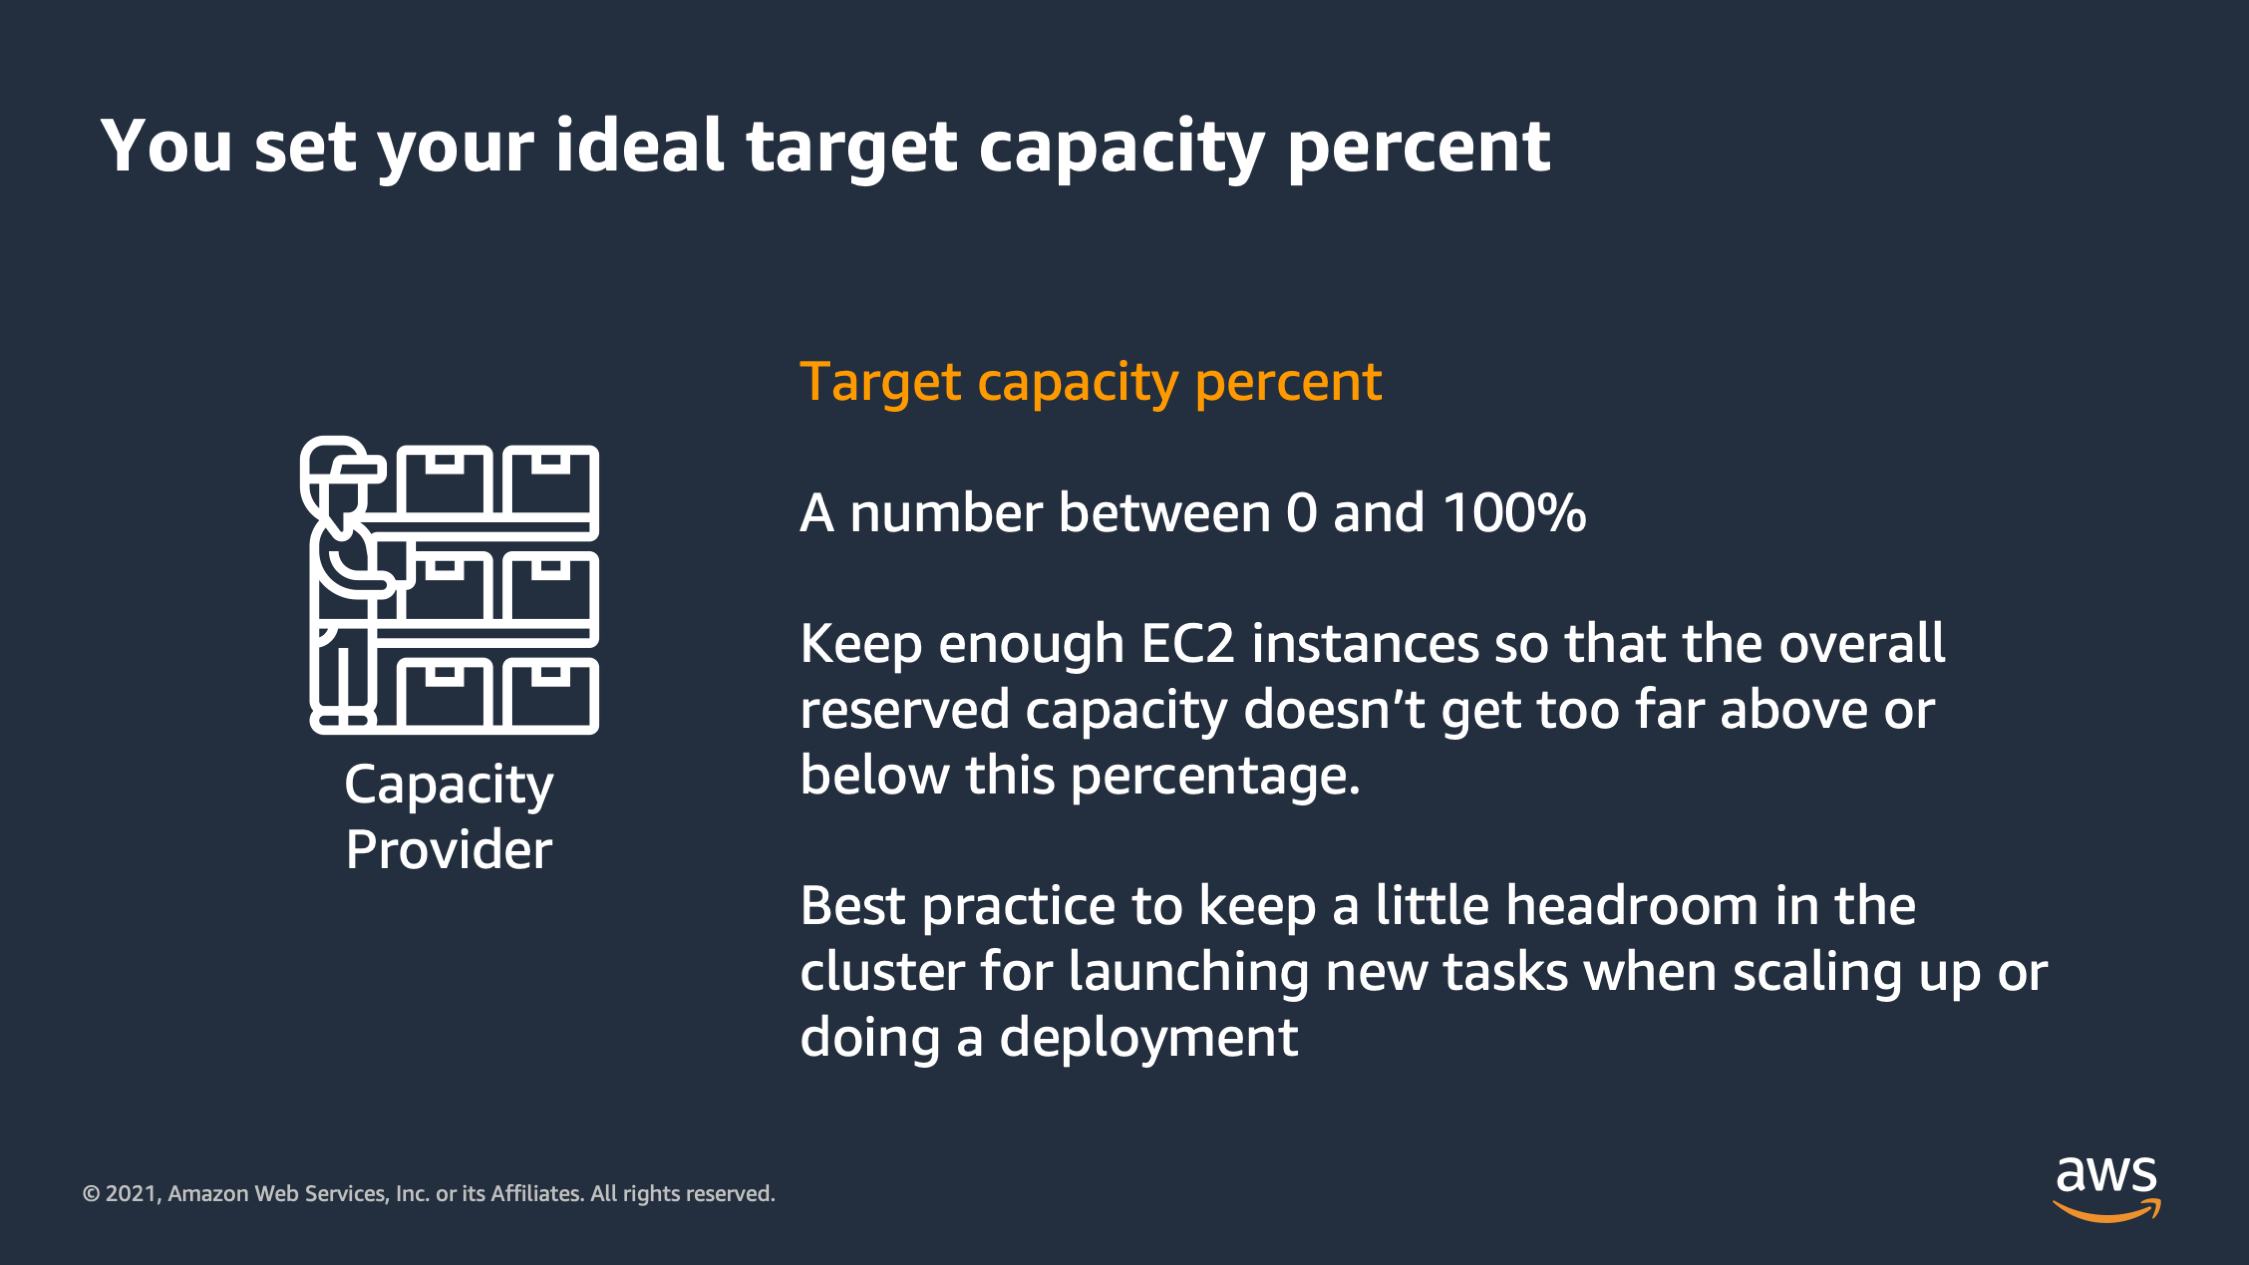
So remember that your target capacity could be any number between zero and 100, but in general, you want to keep enough EC2 instances so that the overall reserved capacity doesn’t get too far below or above. And you want a little headroom in case you need to scale up quickly, or you want to do a deployment and roll some tasks over.
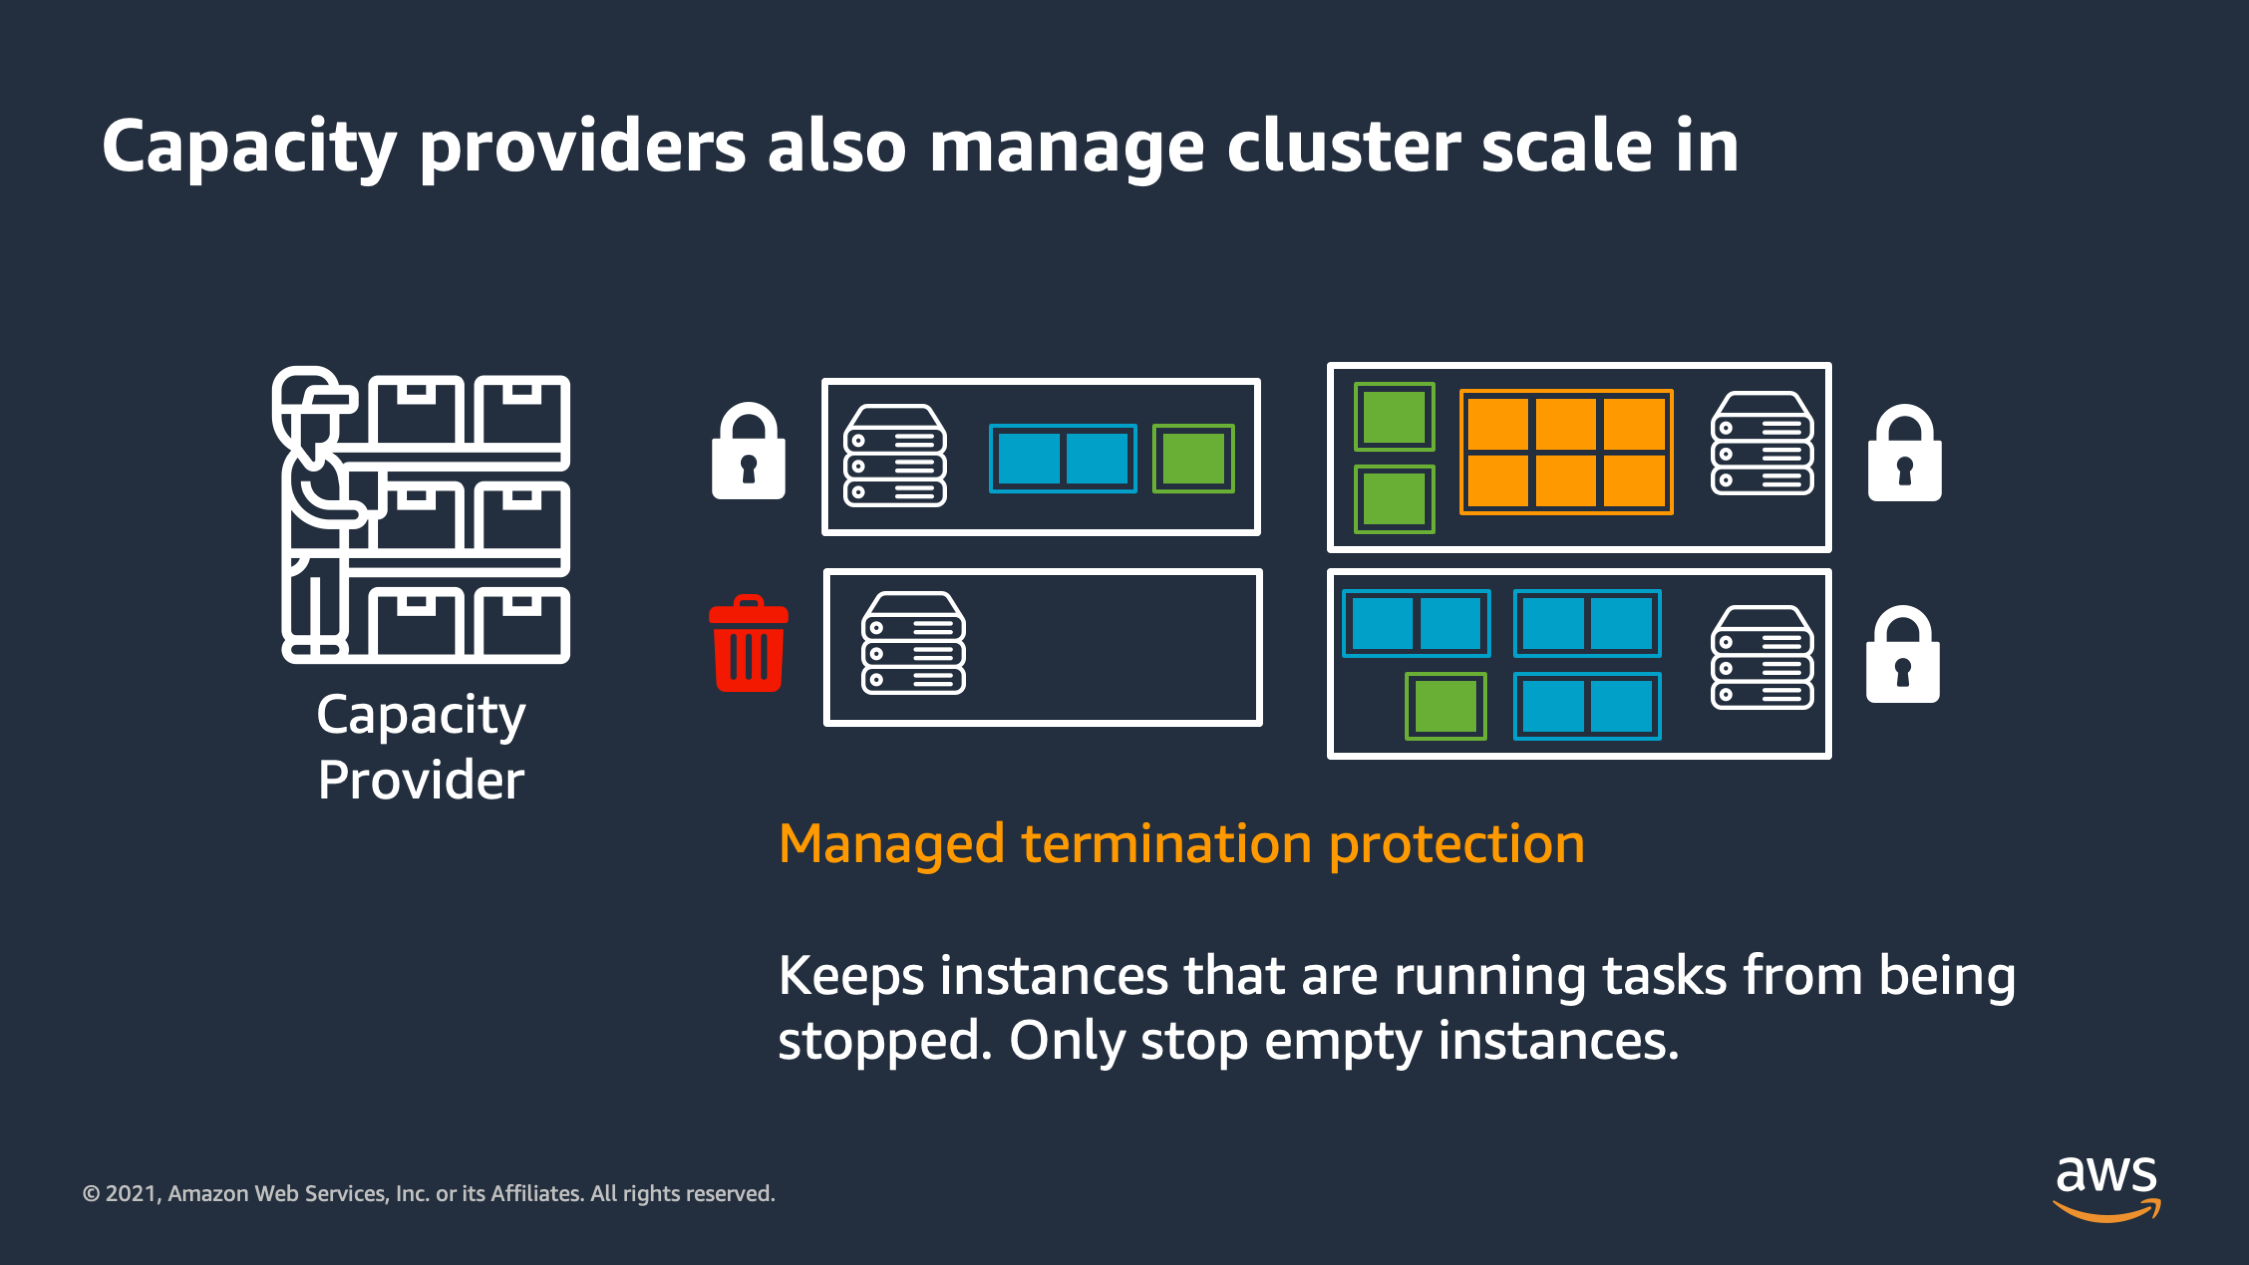
Capacity providers also manage the cluster scale in. So if I have tasks running on an EC2 instance, it’ll lock that EC2 instance, and say: “Don’t stop it. Only stop an instance that is currently unused and doesn’t have tasks running on it.”
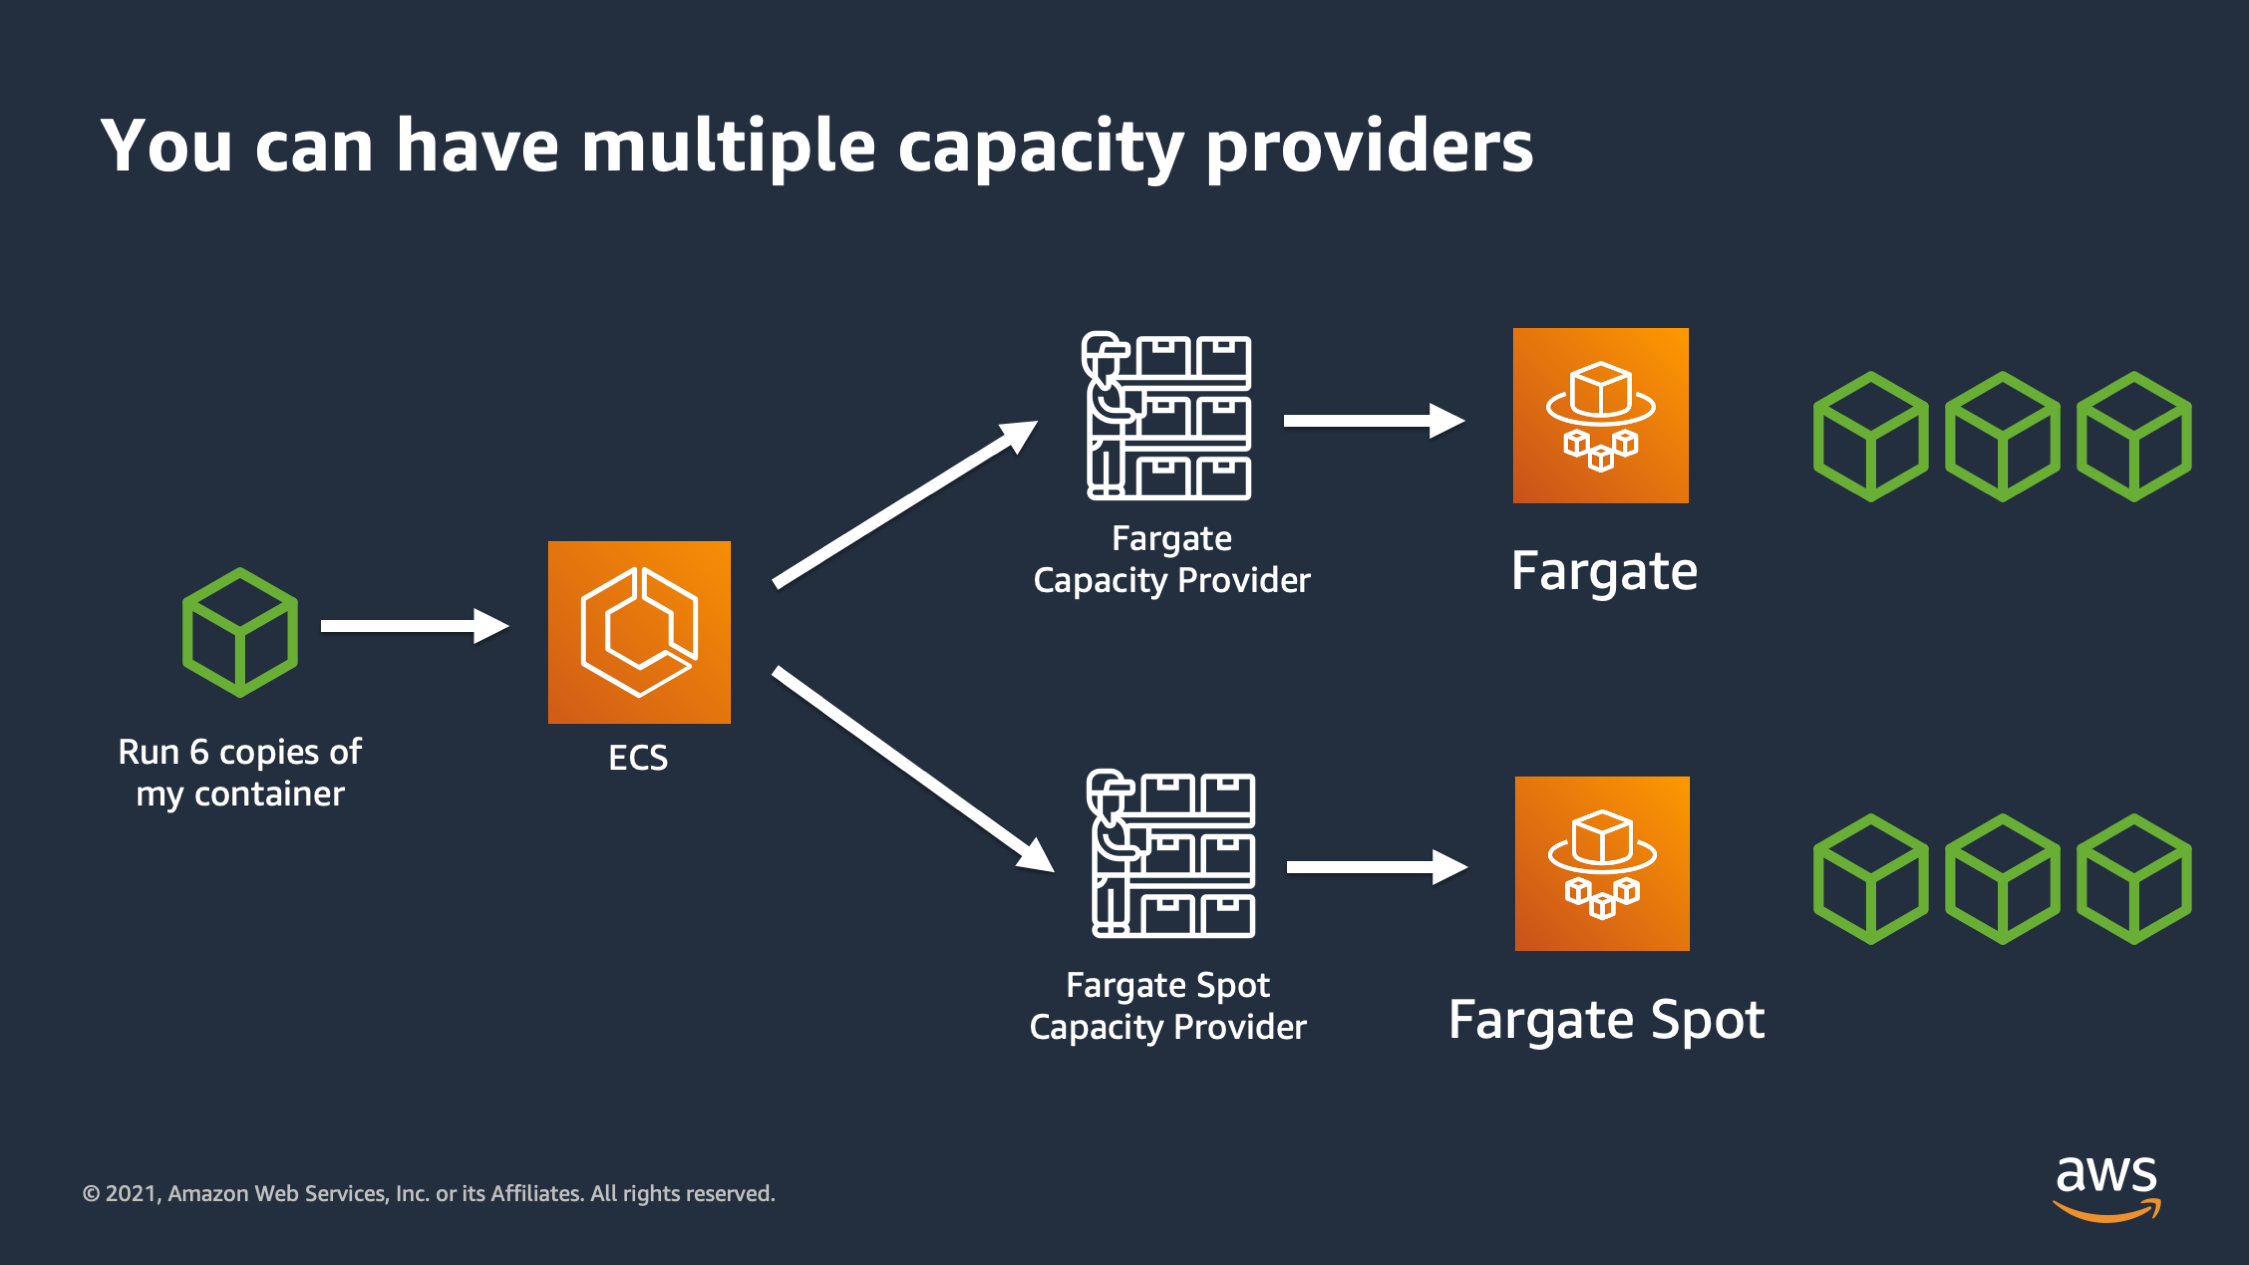
And not last but not least you can have multiple capacity providers. So here I can say: “I would like to run six copies of my container and distribute three to Fargate on-demand in three to Fargate spot.
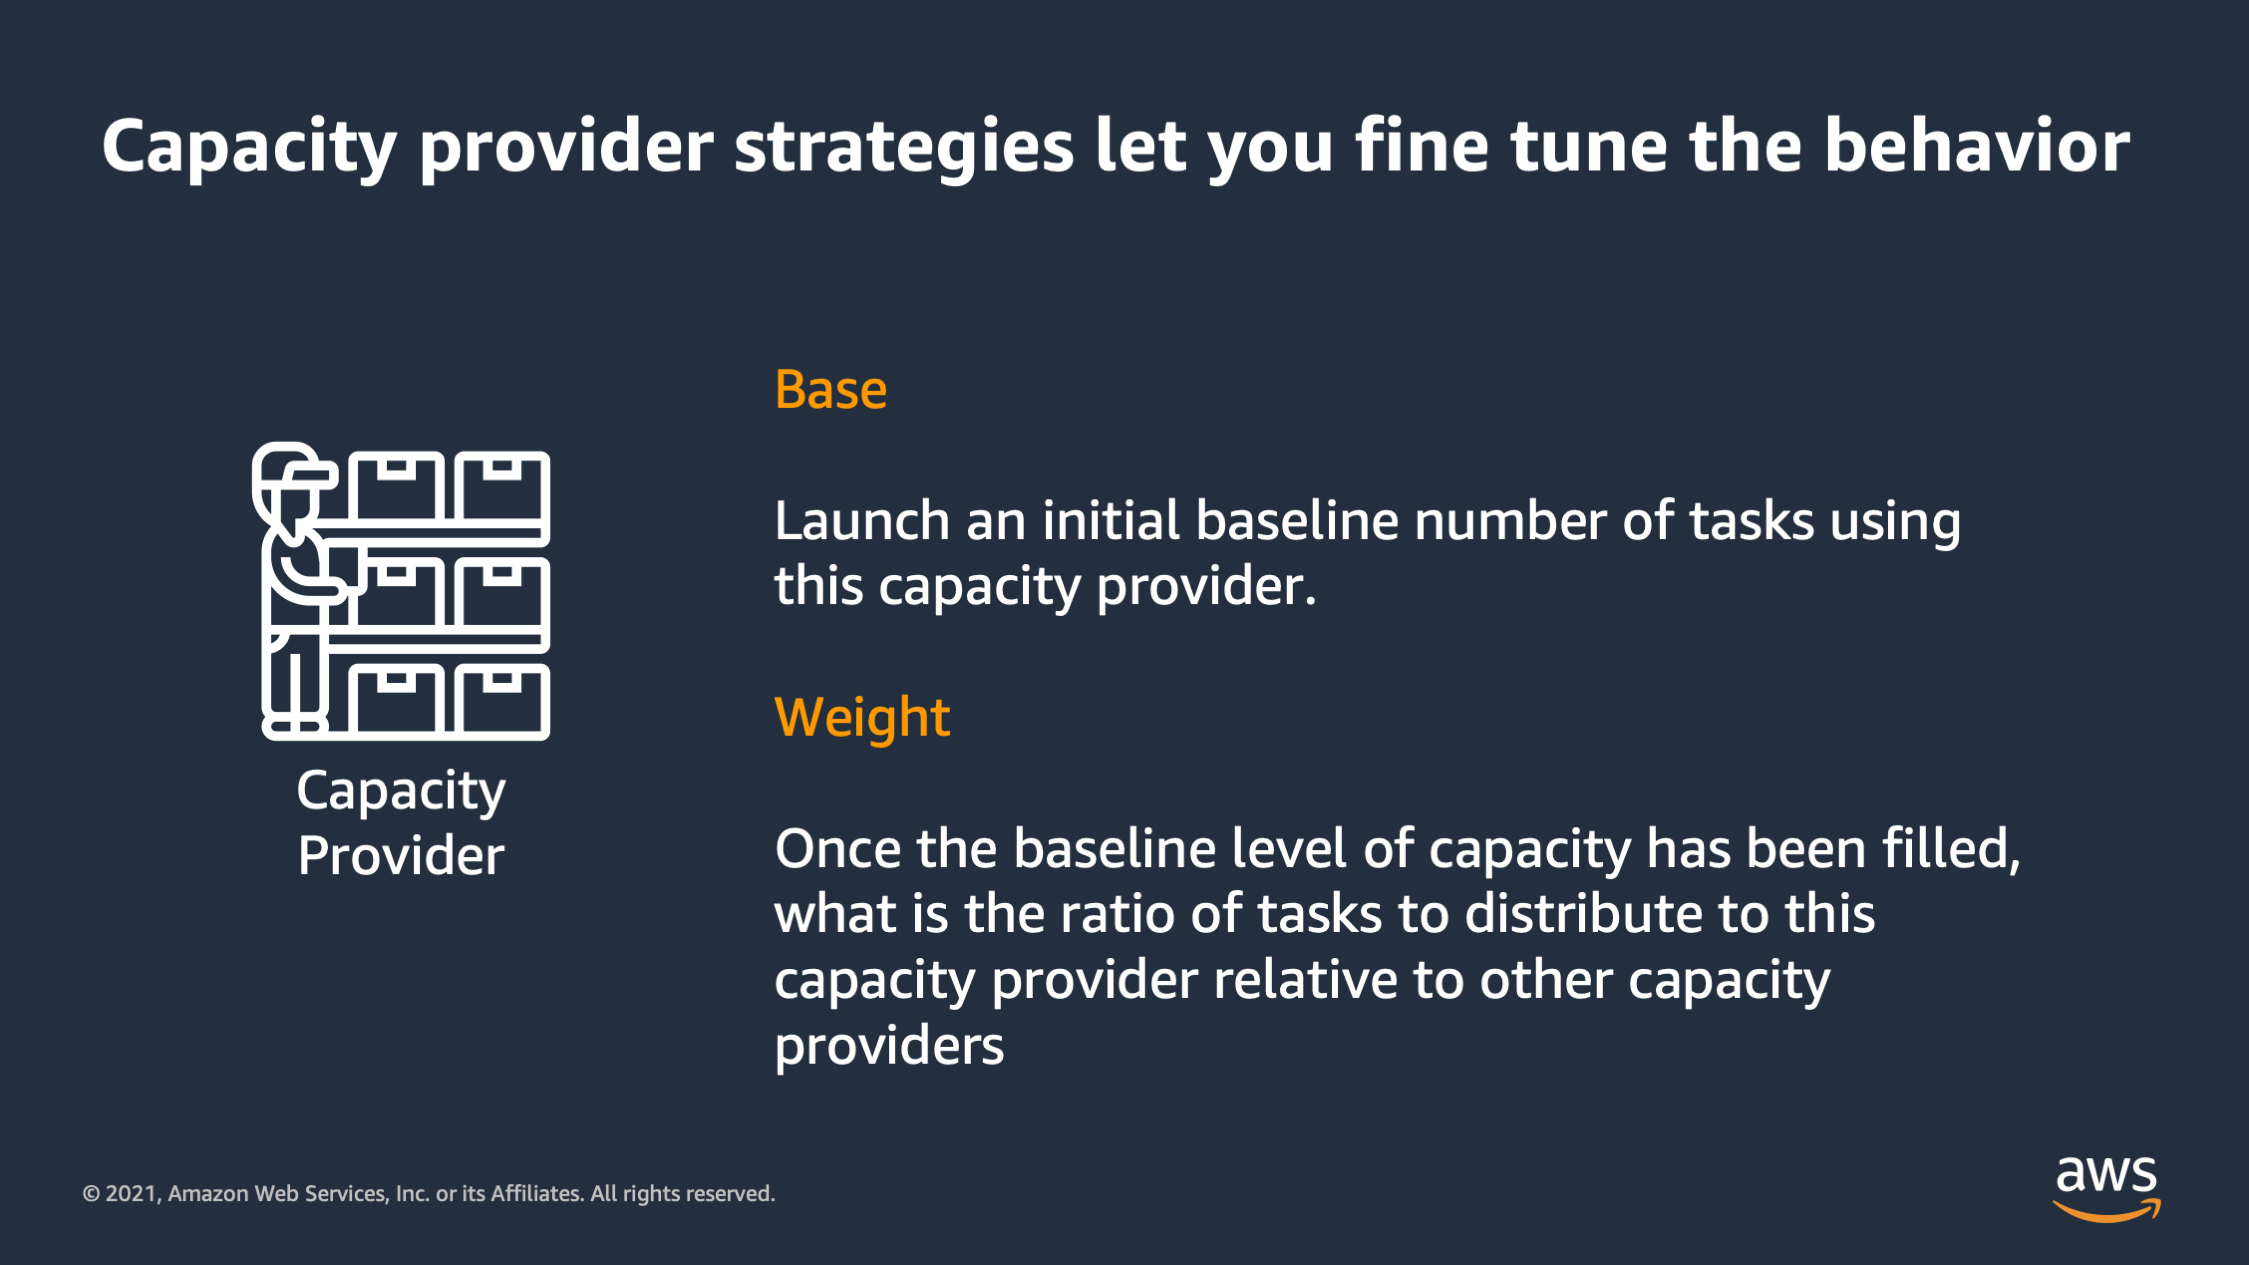
So the way this works is you can specify a base and a weight. The base is the initial baseline number of tasks that you want to place into that capacity provider. And then the weight is, once the baseline has been filled up, what’s the ratio that I want to distribute to different capacity providers. So here’s a couple examples to better explain how that works.
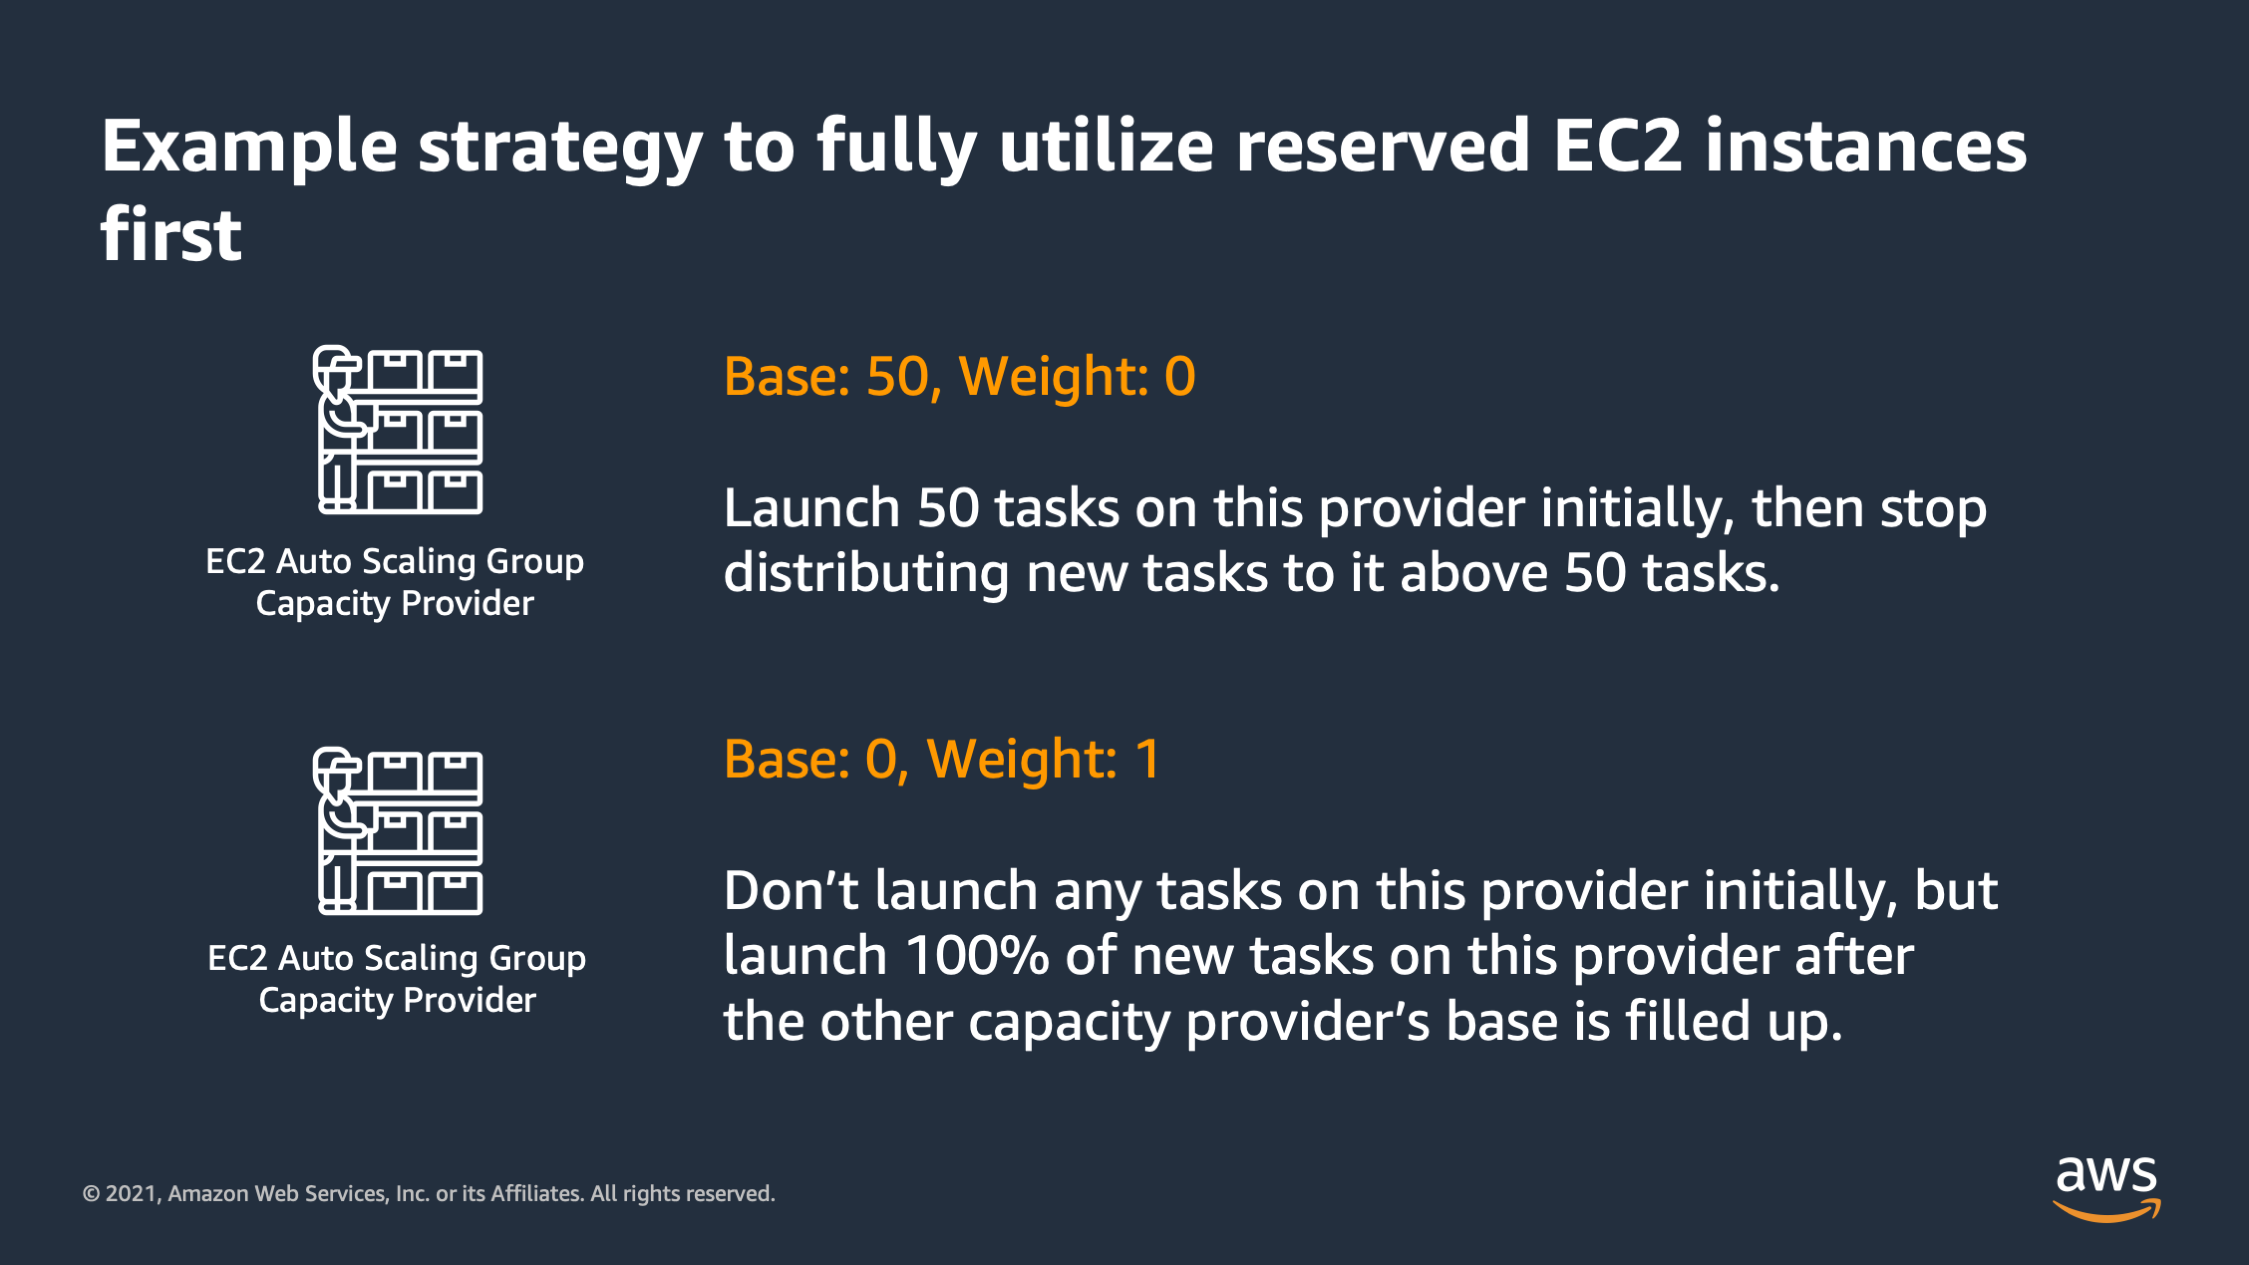
So here’s a strategy to fully utilize reserved EC2 instances first. So I put those EC2 instances that are reserved into one EC2 auto-scaling group, and I say launch 50 tasks. For the 50 base on this provider, and then the weight is zero. So stop putting new tasks on this above 50. So that fully fill up that EC3 auto scaling group first.
But then I say after that, utilize this other EC2 auto scaling group: base of zero, weight of one. So don’t place any tasks on this provider initially, but then after that launch 100%: one out of one of every new task on this provider.
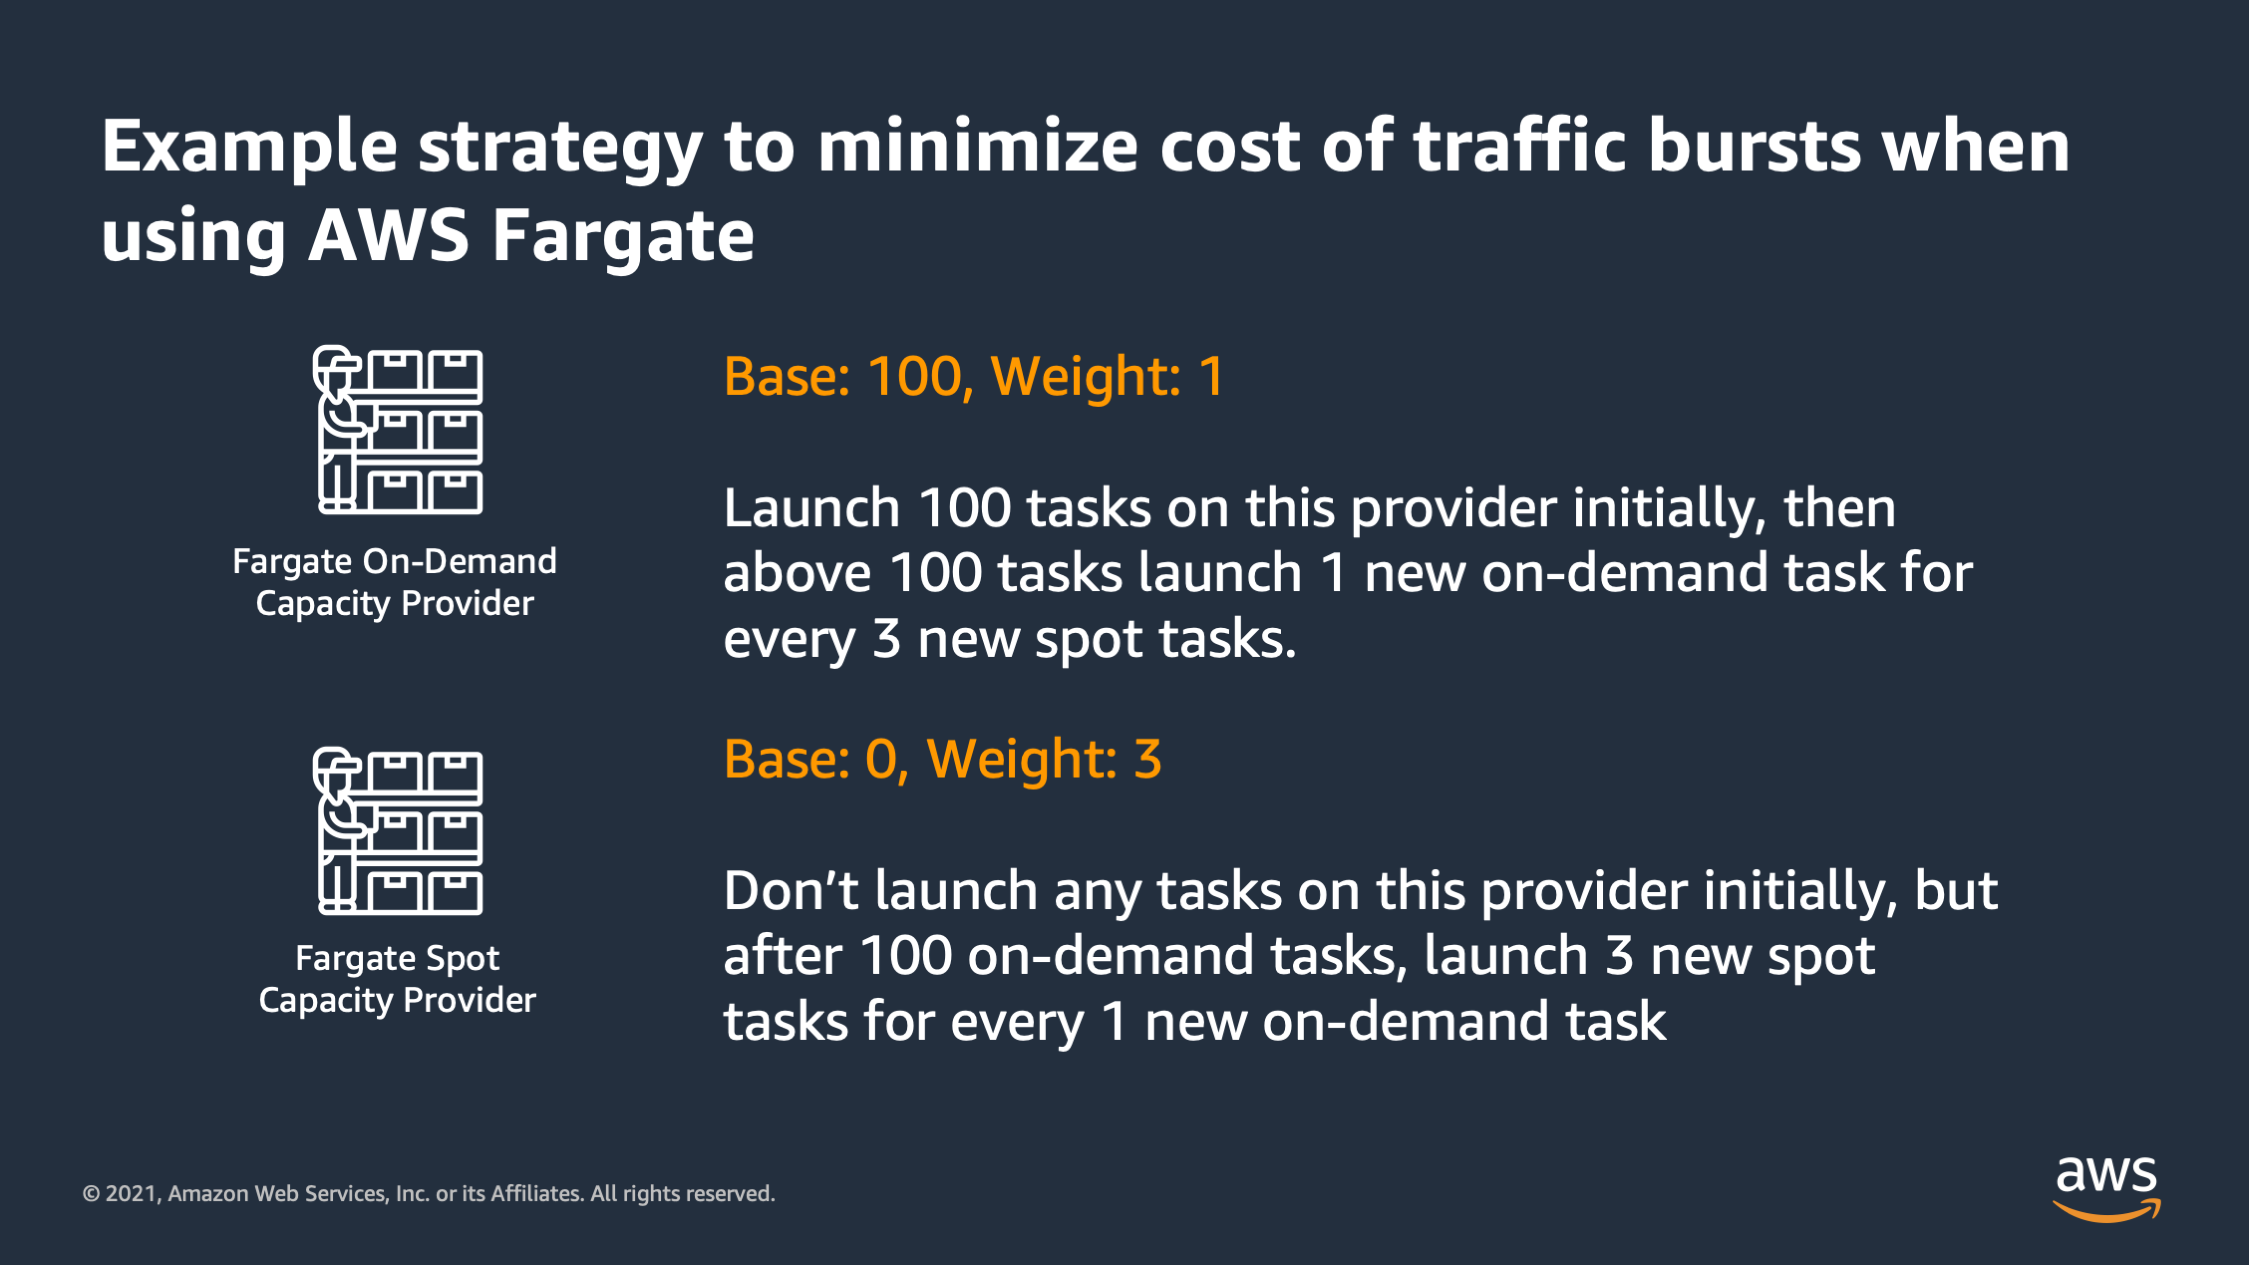
Here’s another strategy if I want to minimize the cost of traffic bursts. I say I would like to launch a base of 100 tasks onto Fargate on-demand capacity provider, and then above 100 launch one new task for every three spot tasks.
So here we’re initially going to place 100 on-demand tasks, and then above that, we’re going to distribute one task to on-demand and then three to Fargate spot. So this allow me to increase the quality of my service as I scale up at a discounted rate by launching three fourths of it actually onto Fargate Spot instead of on-demand.
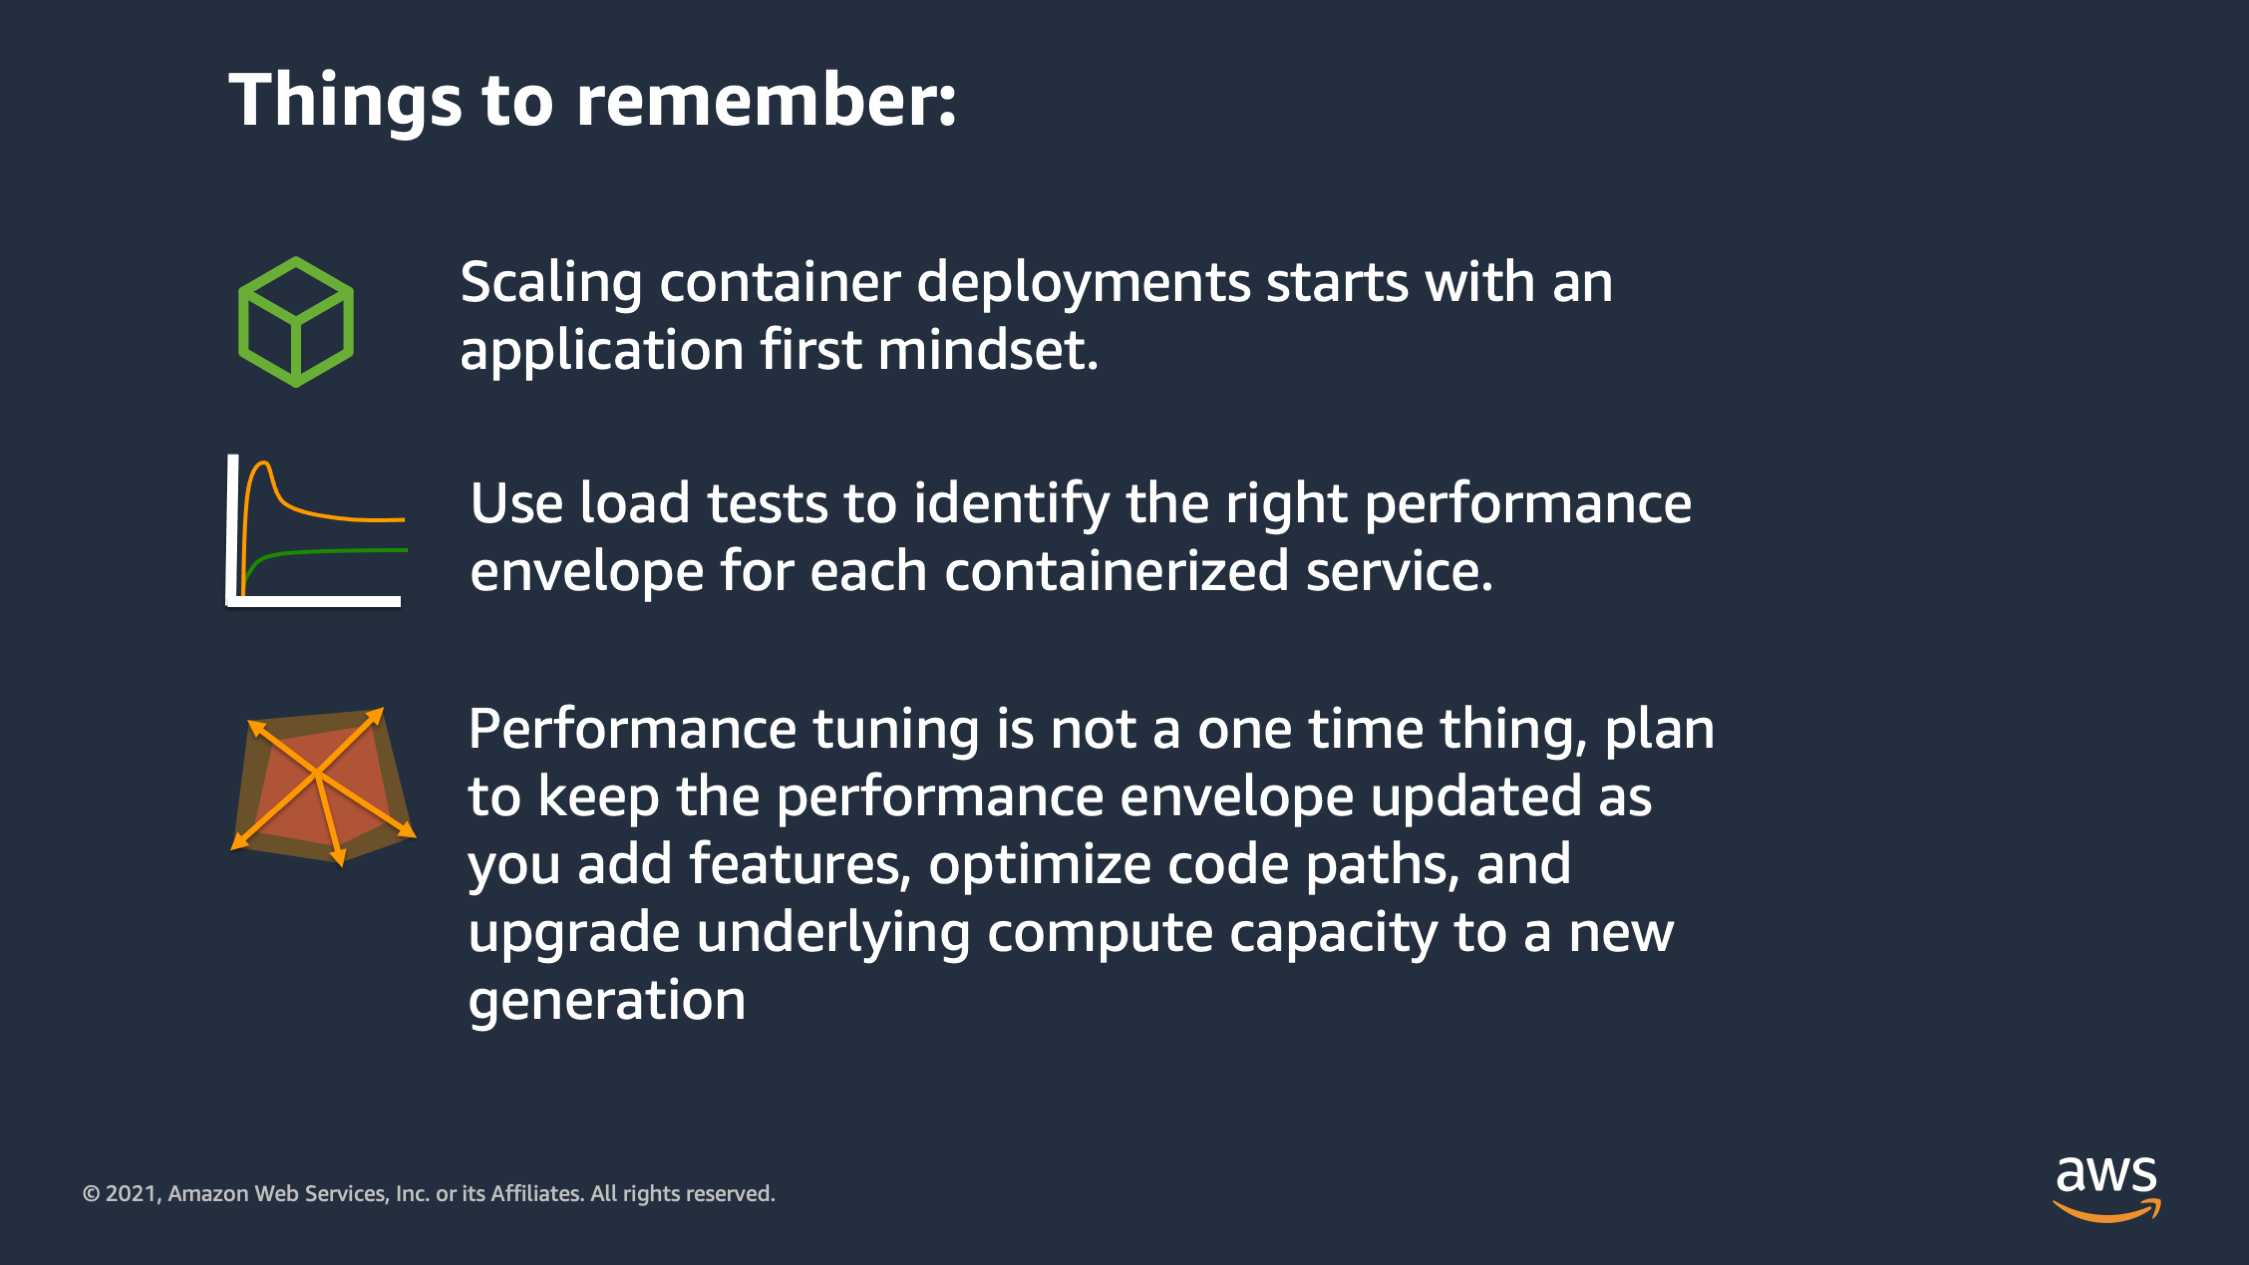
So just to summarize everything, I went over: some things to remember. First of all, scaling container deployments, it has to start with an application first mindset. Second of all, use load tests to identify the right performance envelope for your service and the third when you’re doing your performance tuning, it’s not a one-time thing plan to keep the performance envelope updated as you add features, optimized code paths, and as you upgrade the compute infrastructure that you have underneath in your platform.
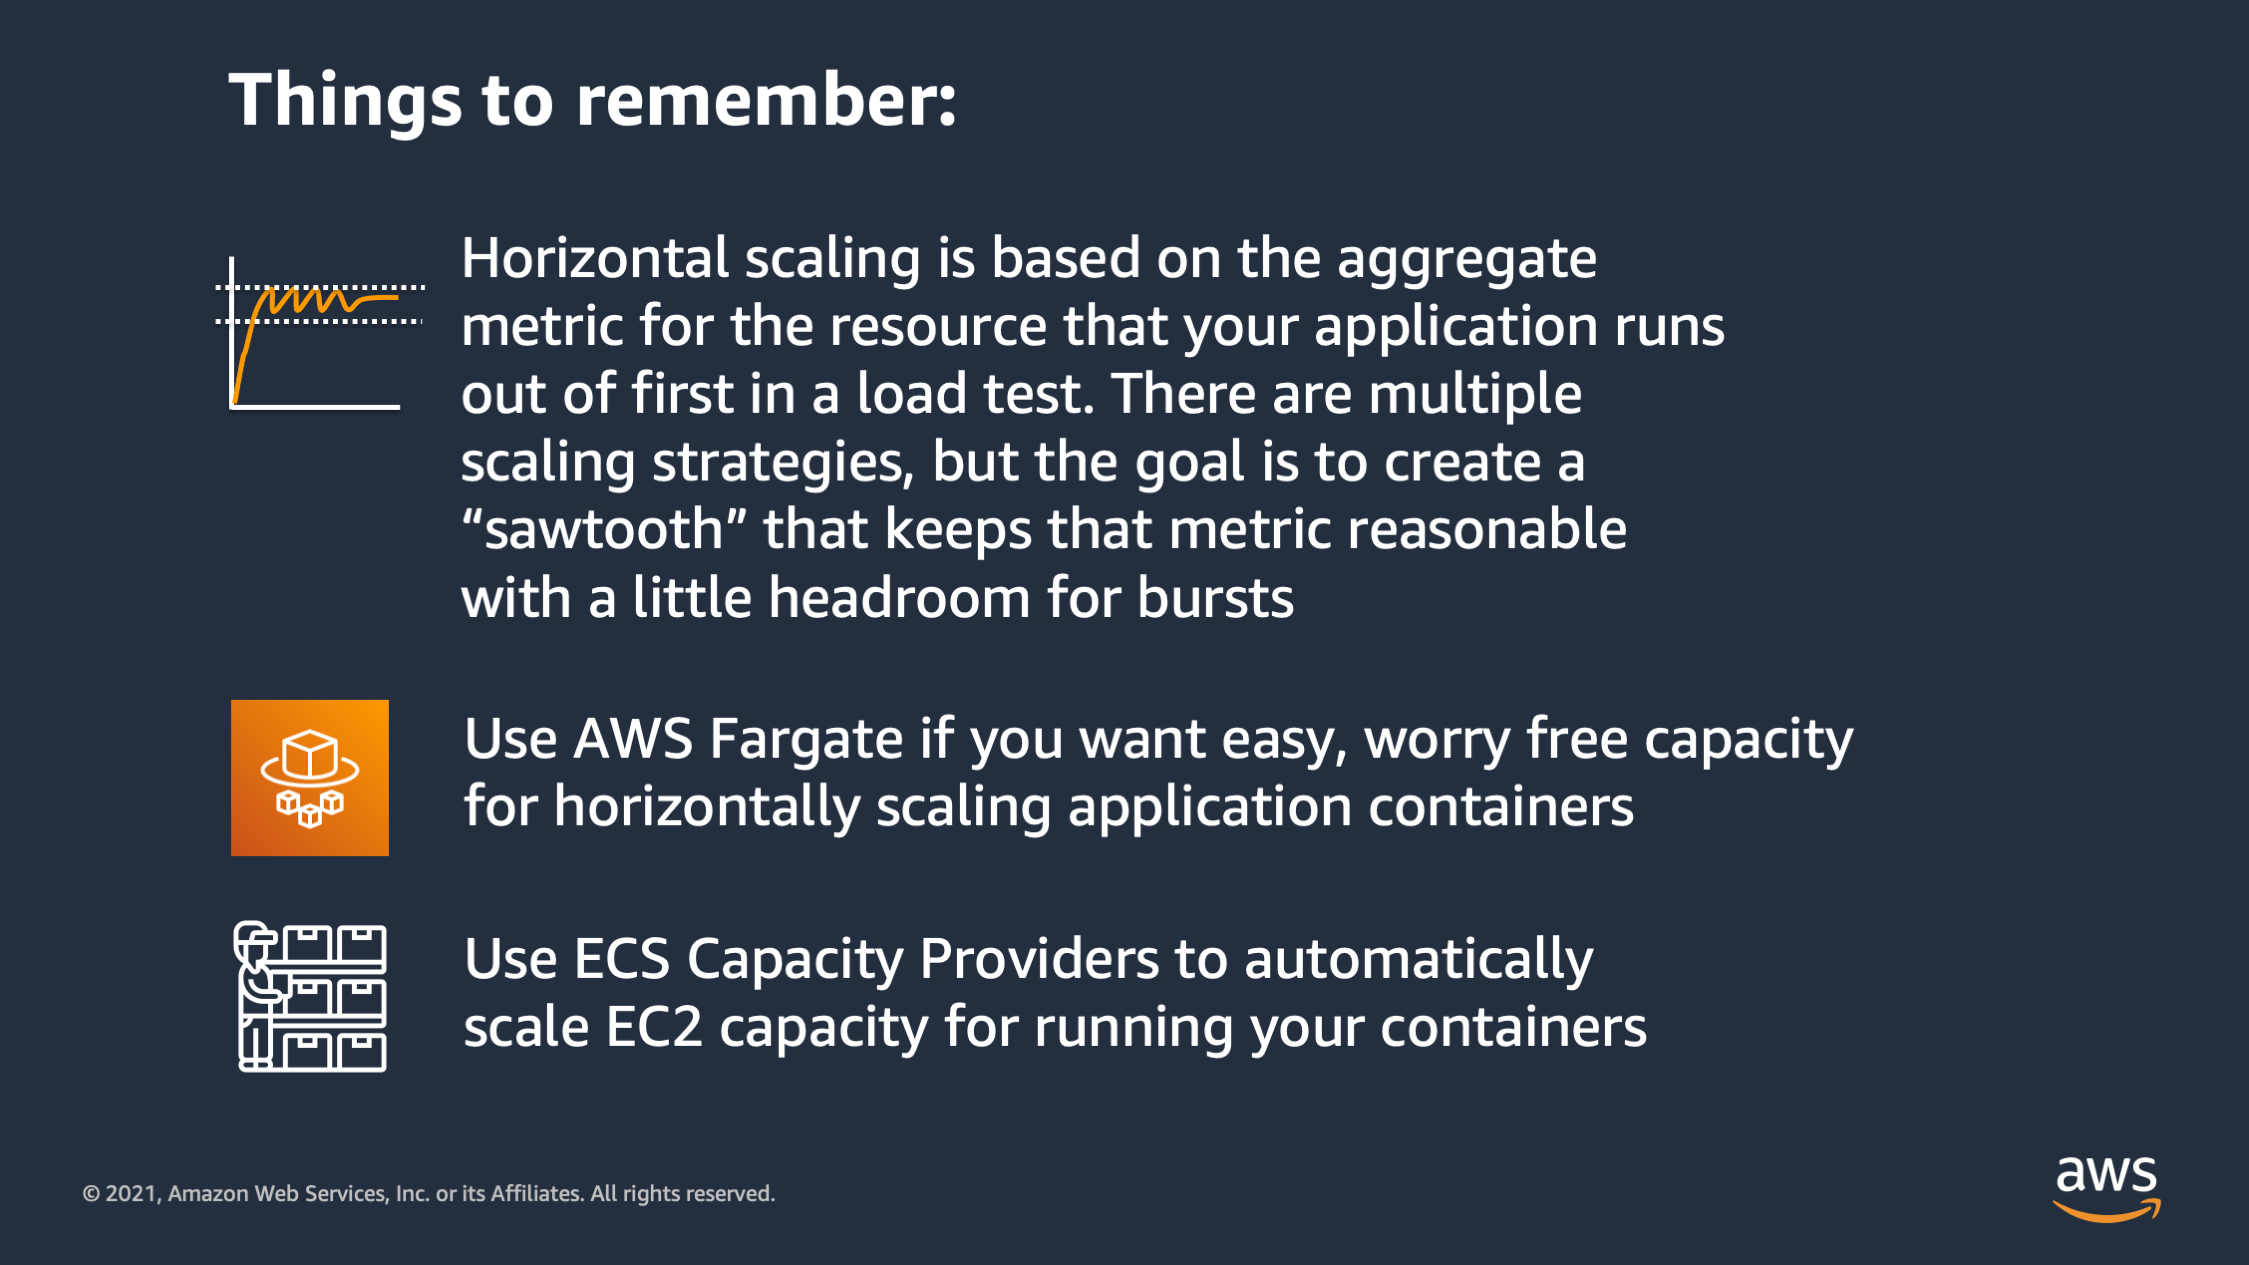
Then third for horizontal scaling: base it on the aggregate resource metric that your application runs out of first when you’re load testing. Your goal is to have a sawtooth that keeps that resource utilization metric within reasonable bounds. Then when it comes to the capacity to actually horizontally scale onto, default to thinking about using AWS Fargate first if you want the easy, worry free capacity. If you do want to manage EC2 capacity yourself, then EC2 capacity providers are there to save the day and help you launch the correct number of EC2 instances as capacity to run your containers across.

So I know this has been a whirlwind of scaling tips. If you have further questions you can chat with @nathankpeck on LinkedIn